

Informix WHERE CLAUSE DATE bug in SAP BusinessObjects
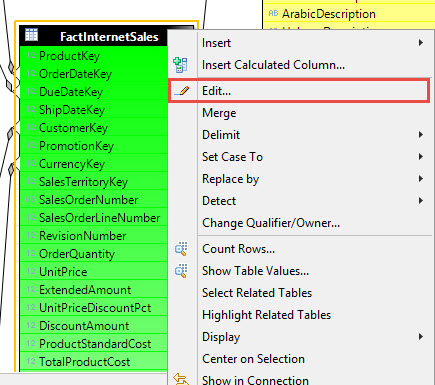
While creating a universe off an Informix database, I discovered a bug that SAP never took care of or provided any documentation on fixing, which was quite of surprising. Basically using a date object in the filter will generate an incorrect WHERE clause. In the following example, we create a simple universe off an Informix database via an ODBC connection Informix ODBC Connection Using...
November 29th, 2021 by David Lai

Connecting HANA Live to SAC and SAP BusinessObjects (Part 3)
Welcome to Part 3 of the HANA Live Connection Series. In this article we will walk through creating a HANA Live Direct Connection to SAP Analytics Cloud. Step 1: Ensure pre-requisites have been met Ensure that HTTPS (SSL) for Client Application Access has been configured http://davidlai101.com/blog/2020/08/27/connecting-hana-live-to-sap-analytics-cloud-and-sap-businessobjects-part-1#https Ensure...
September 8th, 2020 by David Lai

Connecting HANA Live to SAP Analytics Cloud and SAP BusinessObjects (Part 2)
In this article we will go through creating different HANA Connections in SAP BusinessObjects and then using them in different applications. We’ll also talk about the differences between the different types of HANA connections. (more…)
September 8th, 2020 by David Lai

Connecting HANA Live to SAP Analytics Cloud and SAP BusinessObjects (Part 1)
Being able to connect to a live HANA connection via SAP Analytics Cloud or SAP BusinessObjects is important, as query processing is all done on the HANA engine rather than SAC or SAP BOBJ. To accomplish this, you will need to setup SSL capabilities on the HANA side, setup correct user authorization, and then setup the connections on SAC and SAP BOBJ. Unfortunately, this is not so straight forward...
August 27th, 2020 by David Lai

Data masking vs Business object security in SAP BusinessObjects
In the previous article, we talked about how to implement data masking using data security profiles at the universe level to prevent users from viewing sensitive data. Data Masking in SAP BusinessObjects However we can also use business security profiles to limit users from accessing certain objects. In this article, I’d like to present my thoughts on both methods. (more…)
February 23rd, 2019 by David Lai
Data masking in SAP BusinessObjects
One of the cool features with Information Design Tool and UNX universes is the ability to point to different table views depending on your security profile. Because of this, we can easily perform data masking, which allows us to mask restricted data. For example, I have 2 different types of users. Group FULL who can see all revenue/cost measures, and Group PUBLIC who can see revenue measures but...
January 14th, 2019 by David Lai

Checklist of items to watch out for when applying an SAP BusinessObjects patch or service pack upgrade
Every time I apply a service pack upgrade or patch at a client site, I’m always excited about the features or fixes. However it is very annoying that any customizations get overwritten. This includes items such as: Branding, Single Sign-On, Modifications to the login page The following is a checklist of items that I backup beforehand when applying a service pack or patch upgrade (more…)
December 19th, 2018 by David Lai
How to bypass opendocument login screen
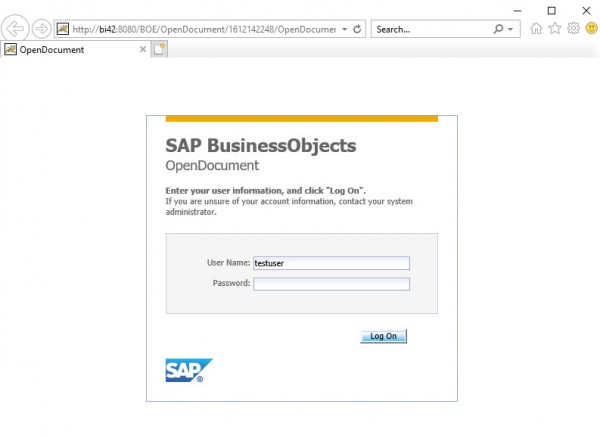
In this article I’d like to show you a simple example of how to bypass the opendocument login. This is especially useful if you are trying to use an opendocument call to open up a web intelligence document from a 3rd party application. It’s quite simple, and you can expand the example to use trusted authentication if desired. Download the custom.jsp here (more…)
April 9th, 2018 by David Lai
First look and thoughts on Fiori-fied BI Launchpad
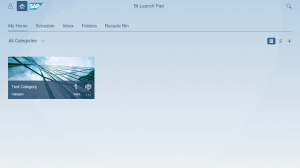
After seeing the Fiori BI Launchpad previews, I was so excited to finally get SAP BI 4.2 SP4 installed on our sandbox. It was literally like opening presents during Christmas as I couldn’t wait to try out the fresh new interface that would be similar to SAP ONE Support Launchpad . After the installation was complete, it was time to log in to the new BI Launchpad. So I typed in the url http://server:8080/BOE/BI,...
September 13th, 2017 by David Lai
About David Lai

SAP BusinessObjects Dashboards 4 Cookbook


