

Handling many-to-many joins using a bridge table (Part 1)
As a data warehouse architect, star schemas are great until we encounter the dreaded many-to-many fact to dimension scenario. For example, we have a Ticket Fact table and a Tag Dimension table. The cost metric is calculated at the ticket level, so tickets have the lowest granularity and hence the ticket fact table. However tickets can be tagged with multiple describers. A ticket can be interesting,...
August 3rd, 2017 by David Lai
CurrentDate() not what you think in Web Intelligence
In Web Intelligence there are a variety of helpful date functions that you can use. 2 in particular are CurrentDate() and CurrentTime(). You would think that CurrentDate() returns just the current date and CurrentTime() returns the current datetime. However both return the exact same result which makes it confusing, especially if you are using date dimensions where the time is stripped off. The funny...
April 10th, 2017 by David Lai

Web Intelligence – Unable to insert comment
The ability to add commentary to web intelligence reports is a powerful new feature released in SAP BusinessObjects 4.2. However, it does not work straight out of the box. Here are some steps to get comments to work. (more…)
November 30th, 2016 by David Lai

Mixing unmerged dimensions in Web Intelligence
The concept of merging queries in Web Intelligence is quite simple, however once you have a requirement of mixing unmerged dimensions in an output table, this is when it gets messy! Let’s take a look at the 2 sample queries below: Query #1 (Sale Revenue by Year): Year, Quarter, Sales Revenue Query #2 (Quantity Sold by State and Year): Year, State, Quantity Sold Each query contains two dimensions...
March 3rd, 2016 by Daniel Li
SAP BusinessObjects Dashboard 4.1 Cookbook now available!
Time flies as the original cookbook which covered SAP BusinessObjects Dashboards 4.0 has been in publication for almost five years. Xavier Hacking and I would like to give a Big Thank You to those who have purchased and benefited from our original cookbook. We hope that it has proven to be a useful resource! Fast forward five years later and we are now proud to be releasing an updated version which...
April 6th, 2015 by David Lai

BEx Query greyed out in Web Intelligence
A common problem when trying to access a BEx Query from Web Intelligence is that we cannot! I want to build a query off the sales test query, however it is greyed out. Well here’s an easy fix. All you need to do is open the query up in BEx Query Designer, go to the Query menu and select Properties Click on the Extended tab and then make sure By OLE DB for OLAP is checked under Allow External...
March 19th, 2015 by David Lai
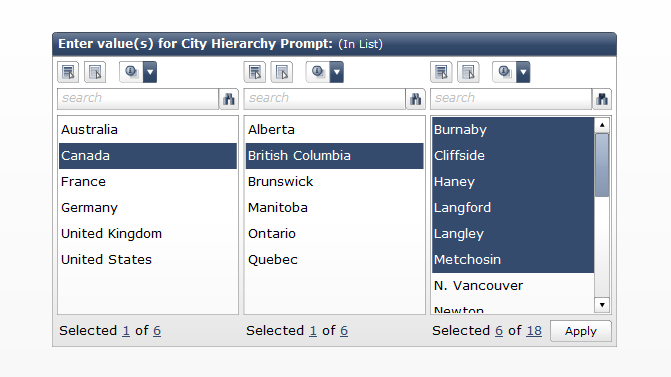
Cascading Prompts in BOBJ Dashboards and WEBI
A cascading prompt, helps the user focus on values they want to include in the prompt without the need to go through every possible value. A great example comes from a list of cities around the world. Imagine if we had to go through a huge dropdown list every time in order to find our desired city. It would be much easier if we can first select a country, then province/state and then the city. This...
March 12th, 2015 by David Lai

Scheduling jobs based on trigger events
Being able to schedule a job based on a trigger event is a very important feature in SAP BusinessObjects. For example, let’s say we have a report that is refreshed daily based on data updated by a daily ETL process. We only want the report to be refreshed if the ETL process completes successfully. There are 2 ways of creating a trigger event. You can either create a file trigger, where the ETL...
March 9th, 2015 by David Lai
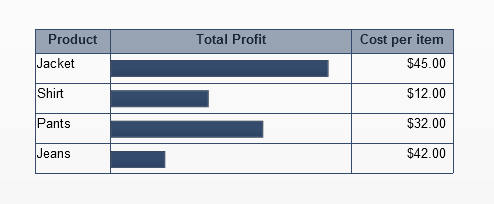
Embed horizontal bar charts in a spreadsheet table component
One of the important features that SAP BusinessObjects Dashboards lacks right now is to be able to embed charts in a table. This is a very powerful feature as we are able to present a lot of meaningful information with little real estate when embedding charts inside a table as shown below. In Xcelsius SP3, SAP took the first step in creating the scorecard component which allows embeddable trending...
February 5th, 2015 by David Lai
About David Lai

SAP BusinessObjects Dashboards 4 Cookbook


