

Mixing unmerged dimensions in Web Intelligence
The concept of merging queries in Web Intelligence is quite simple, however once you have a requirement of mixing unmerged dimensions in an output table, this is when it gets messy! Let’s take a look at the 2 sample queries below: Query #1 (Sale Revenue by Year): Year, Quarter, Sales Revenue Query #2 (Quantity Sold by State and Year): Year, State, Quantity Sold Each query contains two dimensions...
March 3rd, 2016 by Daniel Li
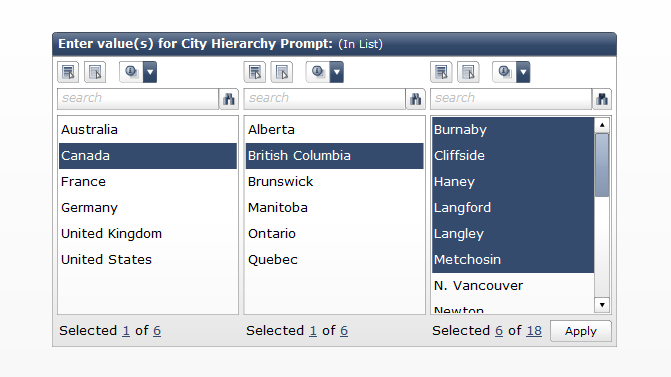
Cascading Prompts in BOBJ Dashboards and WEBI
A cascading prompt, helps the user focus on values they want to include in the prompt without the need to go through every possible value. A great example comes from a list of cities around the world. Imagine if we had to go through a huge dropdown list every time in order to find our desired city. It would be much easier if we can first select a country, then province/state and then the city. This...
March 12th, 2015 by David Lai
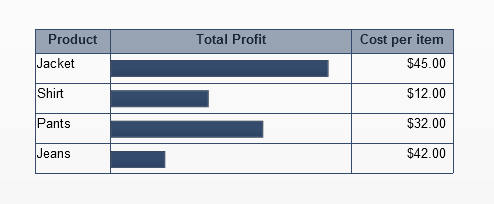
Embed horizontal bar charts in a spreadsheet table component
One of the important features that SAP BusinessObjects Dashboards lacks right now is to be able to embed charts in a table. This is a very powerful feature as we are able to present a lot of meaningful information with little real estate when embedding charts inside a table as shown below. In Xcelsius SP3, SAP took the first step in creating the scorecard component which allows embeddable trending...
February 5th, 2015 by David Lai

Using Xcelsius and Webservices to insert comments into a database
A common request that I have seen with my clients, is the ability to enter comments into a dashboard and then view those comments when they re-open the dashboard in the future. Unfortunately Xcelsius does not have a native mechanism to send data back to the database, as a dashboard’s main purpose to read data and not write back to the database. However, I do see the value in being able to persist...
January 26th, 2012 by David Lai

Embedded Charts inside an Xcelsius Spreadsheet Table
One of the important features that Xcelsius lacks right now is to be able to embed charts in a table. This is a very powerful feature as we are able to present a lot of meaningful information with little real estate when embedding charts inside a table as shown. Embedded Bar Chart in Table (more…)
February 8th, 2011 by David Lai

SAP Crystal Dashboard and Presentation Design (Xcelsius) Cookbook Coming Soon!
I hope that everyone has had a great start to 2011! 2010 was a huge year but 2011 looks to be even bigger! I’m very pleased to announce that the Xcelsius Cookbook, which Xavier Hacking and I have been working very hard on, is scheduled to be released in it’s final format on May 2011. The book will be structured like a cookbook where we will go through step by step on accomplishing different...
February 7th, 2011 by David Lai

Trick to synchronize the hovering/selection of multiple scorecards
Recently for one of my clients, I had to figure out a way to synchronize the selection of multiple scorecard components. The tables needed to be separated but at the same time we needed to make sure that when hover over a row on one table, that the other tables would have the same row highlighted. The easiest way to accomplish this is to have a separator column to separate each table, and then overlay...
December 8th, 2010 by David Lai
Xcelisius Dashboards outside of Infoview with the help of CELogonToken
Not all corporations want their employees to access dashboards through Infoview as some may want to access dashboards through a 3rd party website or portal such as Sharepoint. On top of that, users generally don’t want a login pop-up to appear whenever dashboard data is first refreshed. So we’ll need some sort of hidden login mechanism that bypasses the pop-up and allows data to be refreshed on...
November 18th, 2010 by David Lai

Building Scorecards in Xcelsius 2008 and the significance of Global Embedded Fonts
One of the very powerful new additions to Xcelsius 2008 is the ability to create scorecards easily. If we wanted to create scorecards in Xcelsius 4.5 we would need to manually insert trending icons into each row in order to create a scorecard. In Xcelsius 2008 however we can use a label based menu with alerts. The alerts will act as the trending icons and from there we only need one object to show...
October 21st, 2008 by David Lai
About David Lai

SAP BusinessObjects Dashboards 4 Cookbook


