Fusion Charts Wrapper Online Guide
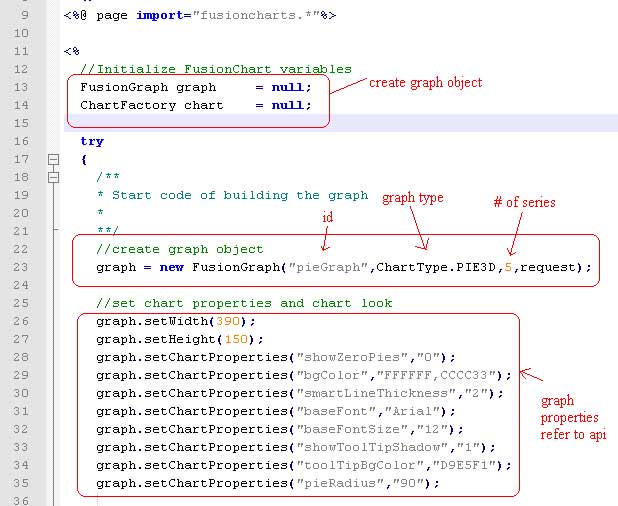
Here’s the online guide to the Fusion Charts Wrapper found at http://davidlai101.com/blog/2010/02/02/fusion-charts-java-wrapper-updated/ If you just need the JavaDocs, please go to http://davidlai101.com/fusioncharts-javadoc/ Steps to build a Fusion Chart in Java Please ensure that you have example.jsp and example_alternative.jsp open in order to follow the steps below to build a fusion graph. If...
February 3rd, 2010 by David Lai
Fusion Charts Java Wrapper Updated
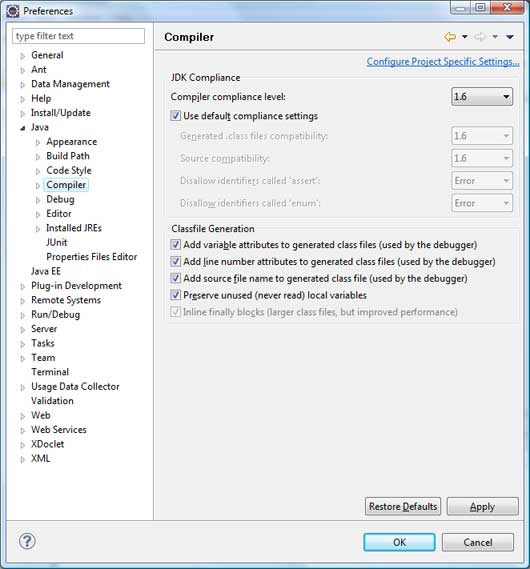
Fusion Charts Java Wrapper v1.0 released I’ve updated the fusion charts java wrapper that I released in a previous post, however many people were having problems getting to work, so I’ve changed some stuff around and updated the wrapper with clear instructions on getting it to work for everyone. The FusionCharts wrapper requires Java 1.5+ in order to run so make sure you have this set in...
February 2nd, 2010 by David Lai
New Look for 2010!
First of all, I’d like to wish all my readers a happy 2010 and Thank you for continuing to visit my blog. I’ve had some busy projects this year and I apologize for the lack of posts, however my new years resolution is to be more proactive this year on my posts 🙂 I’ve finally finished migrating my blog from b2evolution to WordPress, although there’s a few kinks I need to...
January 23rd, 2010 by David Lai
Inovista Microcharts part 2
In my previous article I gave an overview of the Microcharts plug-in for Xcelsius and a quick example of creating a Microcharts Datatable. In addition, I explained how to replicate the same example in Xcelsius using workarounds that would make development much more timely and harder to maintain. In this article I would like to talk about some important features that Inovista Microcharts has that Xcelsius...
October 20th, 2009 by David Lai
Introduction to Inovista Microcharts
For those of you who have seen or used Bonavistas Microcharts on Excel http://www.bonavistasystems.com/. You’ll appreciate how you can show a huge amount of data on the screen without becoming too overwhelming to the end user. Using data tables with sparklines, bulletgraphs, etc puts data in a format where it is easy to read for the human eye. [kml_flashembed publishmethod=”dynamic”...
October 16th, 2009 by David Lai
BEWARE OF FREDERICK CARTER (Pathway Technologies Inc)
This is a warning to all consultants and anyone who has professional contact with Frederick Carter. I’ve worked with many clients in the BI and BOBJ industry and unfortunately this is the first customer that I have provided services for who ran away without paying. Apparently Frederick needed some work accomplished in a short period of time and I was generous enough to complete a week’s...
August 11th, 2009 by David Lai
Simulating Excel Conditional Formatting in Xcelsius
Conditional formatting in Excel is a feature that is very commonly used and very useful in displaying how well a set of values in a table are doing. Unfortunately we can not transfer the dynamic nature of conditional formatting from Excel to Xcelsius if we were to just insert the table selector object. Basically if the initial binding color of a cell was “Green”, it would stay green even...
August 9th, 2009 by David Lai
Fusion Charts Java Charting Package
NOTE: Please note that the wrapper has been updated and you can get the latest code at http://davidlai101.com/blog/2010/02/02/fusion-charts-java-wrapper-updated/ I’ve created a Fusion Charts package that acts as a wrapper for the Java developers out there. The charting package will help you attach data to your series and construct your graph. In addition, there is a ChartFactory class which builds...
April 30th, 2009 by David Lai
Fusion Charts DOM Fix
FusionCharts DOM is a JavaScript framework that helps you include FusionCharts in your web applications in a very elegant and easy way. Instead of writing standard Javascript codes or OBJECT/EMBED tags to embed charts, you can use FusionCharts DOM to create a chart by just including <fusioncharts> … </fusioncharts> tags in your HTML code. Configuration of the charts is as simple...
April 28th, 2009 by David Lai


