Embed horizontal bar charts in a spreadsheet table component
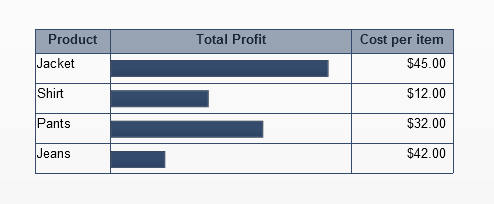
February 5, 2015 by: David LaiOne of the important features that SAP BusinessObjects Dashboards lacks right now is to be able to embed charts in a table. This is a very powerful feature as we are able to present a lot of meaningful information with little real estate when embedding charts inside a table as shown below.
In Xcelsius SP3, SAP took the first step in creating the scorecard component which allows embeddable trending icons inside cells of a table. However having the ability to embed other objects in a table would be even better.
In this article we will go through step by step on how to embed a horizontal bar inside the rows of a table, which will allow end users to be able to compare each row visually which adds great value as we can see other misc table items at the same time.
A big thanks goes to Michael Thompson for coming up with a WEBI solution here

Which has inspired me to come up with the same idea for SAP BusinessObjects Dashboard.
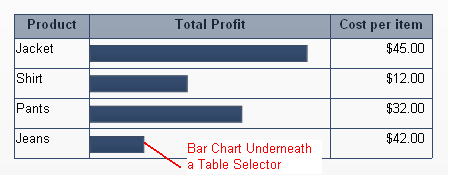
The first option is if the number of rows are static. We can simply insert a column chart a spreadsheet table so that it looks like it’s part of the table.
This solution is not very flexible as we cannot control the synchronization of bar size and spacing with a table that has a dynamic number of rows.
In this article we will walk through step by step instructions on embedding horizontal bar charts inside a spreadsheet table
Step 1
Create a web intelligence document using the eFashion universe. Select Lines and Sales Revenue in your query.
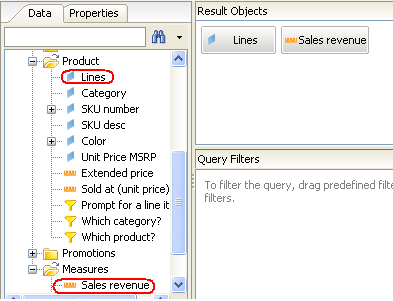
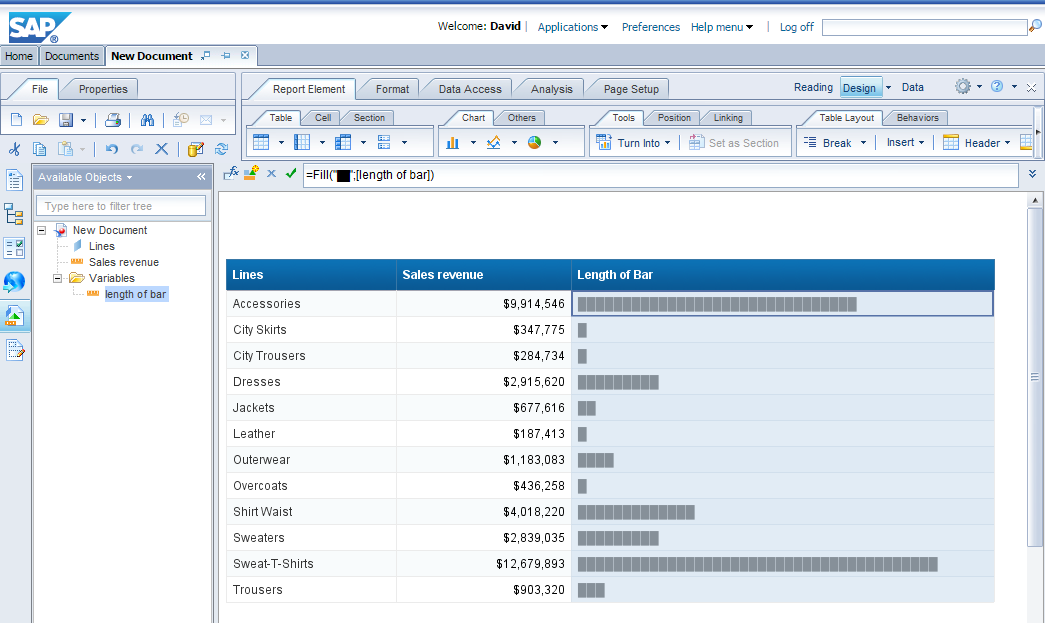
By default the table will come up with 2 columns (Lines, Sales revenue). Create a third column called Length of Bar which will contain the embedded horizontal bar.
Step 2
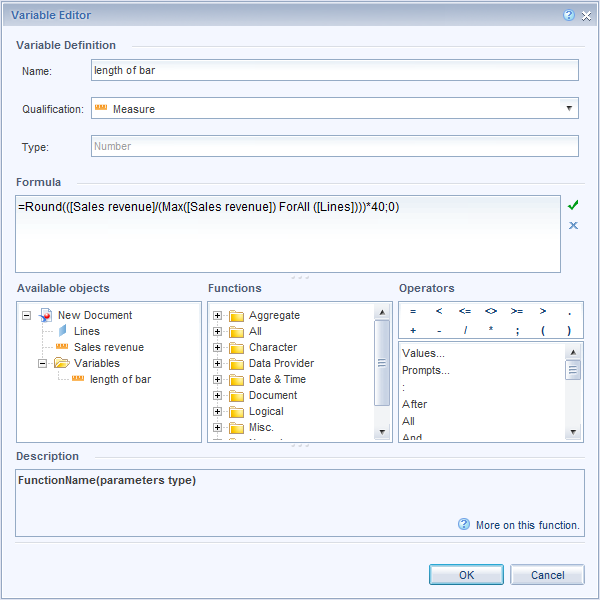
Create a variable called length of bar. The formula for the variable will be
=Round(([Sales revenue]/(max([Sales revenue]) forall ([Lines]))*40;0)
We use a multiple of 40 because with 100 the bar is too long.
Step 3
Open up Microsoft Word, then select Insert -> Symbol. Make sure the Font is set to (normal text) and select Character code 2588 from Unicode (hex).
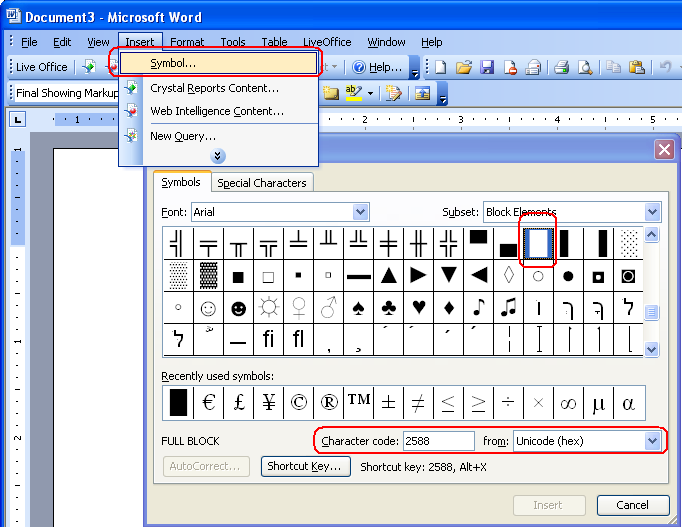
Copy the symbol that you have selected.
Now on the Length of Bar column, insert the following formula:
=fill(pasted symbol from Word;[length of bar])
Step 4
Save the WEBI document. Publish a BI Web Service called embedded_chart. When you test your BI web service, it should look like the following:

Step 5
Now open up SAP BusinessObjects dashboards and set up the data manager so that it points to the embedded_chart BI Web Service. Let’s assume that the max size of the table is 20 rows.
Bind the output to cells A2:C21
On the Usage tab, set the Refresh Options to Refresh Before Components Are Loaded

Step 6
Drag a spreadsheet table onto the canvas and bind the data to cells A1:C21 (Note: You may want to change the font settings in your spreadsheet for aesthetics)
On the Behaviour tab, in the Ignore Blank Cells section, click on the checkmark for In Rows

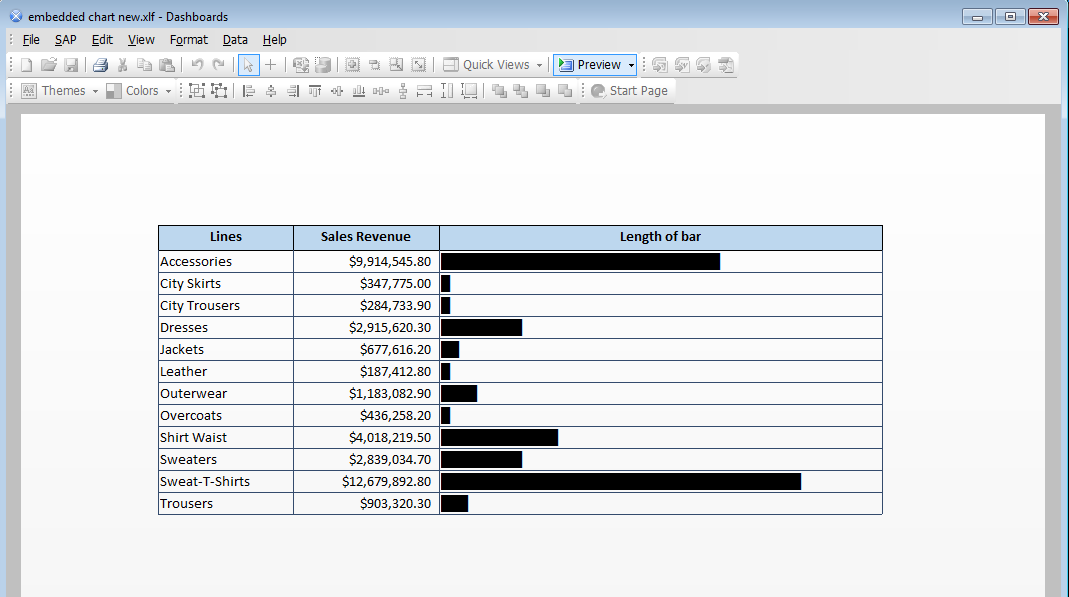
Step 7
Preview your dashboard! You should now see an embedded bar chart inside your table!