

Getting BI Web Services to work in WEBI Richclient through https
Recently I had a client who switched from http to https; and although it seemed like a simple transition in some places, it was tricky in others such as WEBI Richclient. With WEBI Richclient, we noticed that we could no longer publish or view our BI Web Services as the BI Web Services area was just hanging. One workaround would be to just give up and work through WEBI in BI Launchpad, however if the...
April 29th, 2014 by David Lai
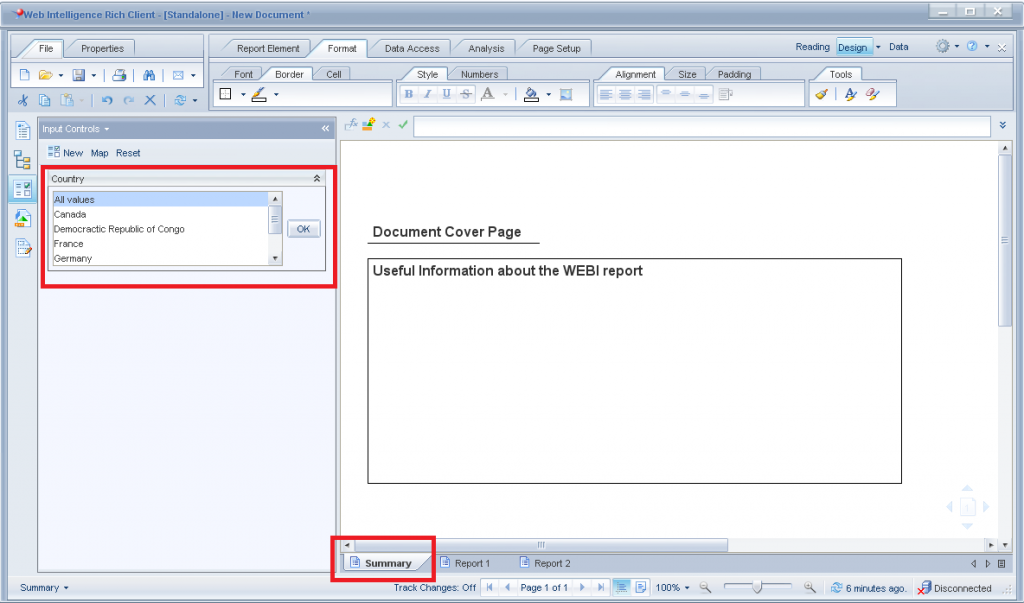
Web Intelligence – Input Control that affects all tabs
One of the major limitations in Web Intelligence is the ability to use 1 input control to control filter selection for “All” tabs. For example, if I had 5 tabs and wanted to have a country input control that is applied to all 5 tabs, I would need to create a separate input control for each tab. In addition, if users want to filter on a particular country during runtime, they must REMEMBER...
August 13th, 2013 by David Lai

Creating proper WEBI BEX hierarchy prompts
In this article I’d like to present how to properly create a hierarchical selection prompt in WEBI. The most natural way to create WEBI selection prompts is to create the selection prompt directly on WEBI. Unfortunately whoever designed the WEBI hierarchical selection prompt did not put proper thought into it. Let’s first go through the incorrect way of creating a WEBI hierarchy prompt and...
August 9th, 2013 by David Lai

Custom BW hierachy level selection in WEBI
Connecting to BW using a BICS connection in WEBI is pretty cool, but unfortunately the ability to select a desired level from a hierarchy proves to be very difficult without any tricks. A common request that I’ve been finding from clients these days is the ability to select a desired level in a hierarchy and not have to expand all the way through in order to see that level. (more…)
April 8th, 2013 by David Lai

Bursting Reports in Business Objects to Dynamic Recipients
This post is a continuation of my previous post on Bursting Reports in Business Objects The difference here is that instead of distributing the reports to Business Objects users, we’ll be able to dynamically control our user list that we will distribute our reports to externally. Dynamic Recipients are often used with Crystal Reports that are not connected to a Universe and do not have BOBJ...
November 5th, 2011 by David Lai
Step by Step guide on bursting reports in Business Objects
The ability to publish and schedule reports according to one’s profile is an important feature that we have in Business Objects. For example, if I am a plant manager for a the West Region and want to receive a daily report on work quality, it would be very beneficial if I can receive a report in my inbox daily that only contains results for the West Region. This would save me the hassle...
October 27th, 2011 by David Lai

Cascading List of Values
List of Values is a powerful feature that allows users to select from a pick list when setting conditions in a query. This is especially important if you want to query on codes linked to a set of products. Using the List of Values feature, you will not need to memorize which codes go to which products. The part that I would like to focus on is Cascading List of Values. In a real world Data warehouse...
January 8th, 2009 by David Lai
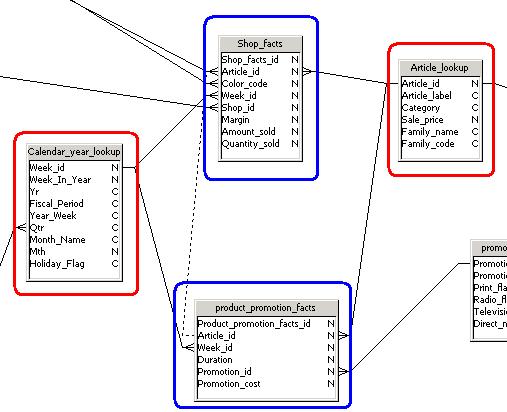
Preventing Chasm and Fan Traps!
In this article I would like to talk about Chasm traps and Fan traps. These are problems that we often experience while building universes and reports. When encountering these traps, one may wonder what is going on? How come my sum statements arent adding up correctly? Or why am I missing some rows? A properly designed universe will help avoid these problems. In addition, a good understanding about...
November 18th, 2008 by David Lai

All you need to know about opendoc
I’ve seen quite alot of postings in the Business Objects forum on calling the opendoc function from either a web intelligence report or Xcelsius dashboard. You can download the pdf instructions on all the opendoc parameters here opendoc detailed instructions I’ve also provided instructions on drilling down to a Web Intelligence document from Xcelsius here And an Xcelsius open doc worksheet...
November 4th, 2008 by David Lai
About David Lai

SAP BusinessObjects Dashboards 4 Cookbook


