
Mixing unmerged dimensions in Web Intelligence
March 3, 2016 by: Daniel LiThe concept of merging queries in Web Intelligence is quite simple, however once you have a requirement of mixing unmerged dimensions in an output table, this is when it gets messy!
Let’s take a look at the 2 sample queries below:
- Query #1 (Sale Revenue by Year): Year, Quarter, Sales Revenue
- Query #2 (Quantity Sold by State and Year): Year, State, Quantity Sold
Each query contains two dimensions and one measure. The Year dimension, common to both, will be merged leaving the dimensions Quarter and State unmerged. Presented below are the two queries as separate tables. 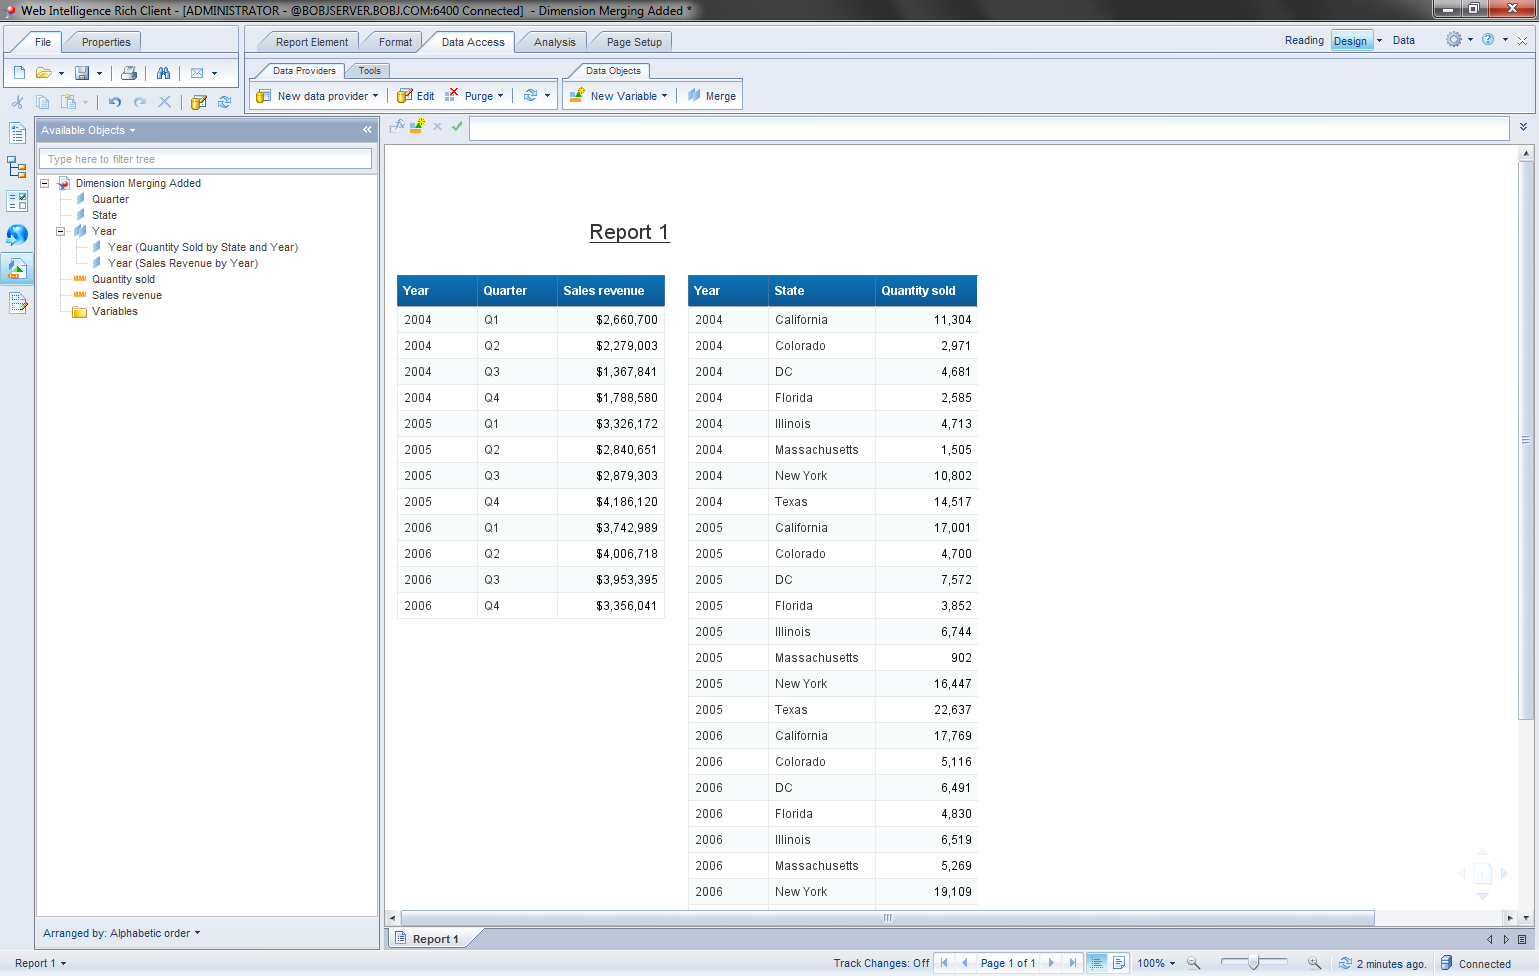
Drag the dimensions in this order Year, Quarter and then State to an output table. Note the incompatibility error when trying to drag the State dimension even when the Year dimension is merged. Web Intelligence does not allow multiple unmerged dimensions from 2 different queries. It allows users to include unmerged dimensions from only one of the queries. In this example, we can either have the Quarter dimension or the State dimension, but not both. This is to prevent Cartesian products, thus the incompatible object error. 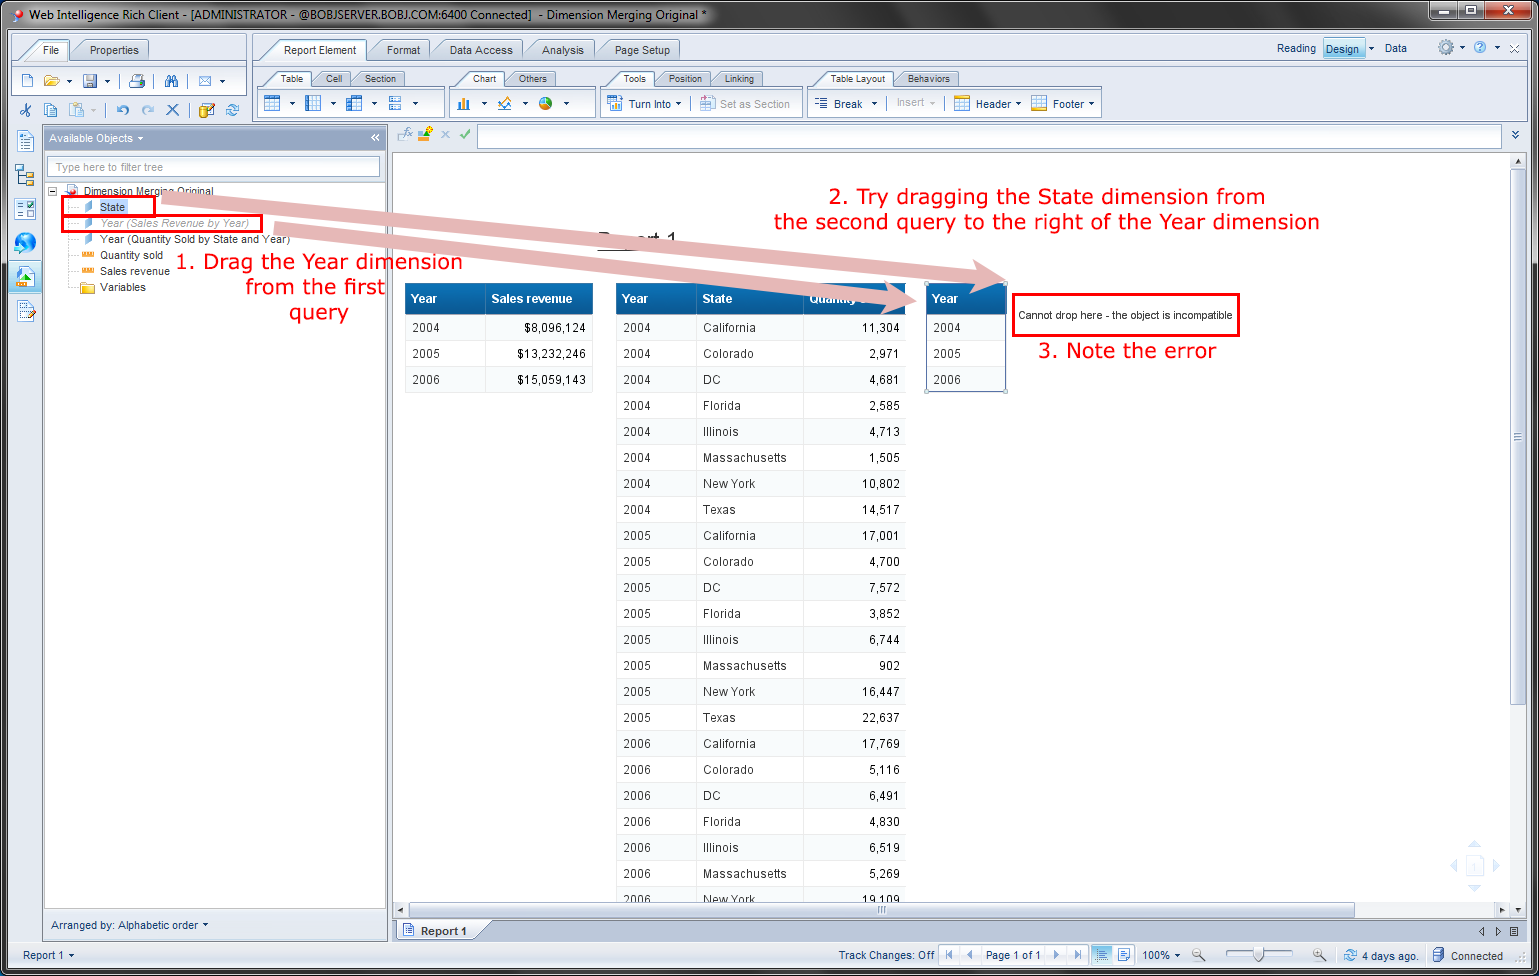
Cartesian Product Issue
A Cartesian product is equivalent to a cross join which produces an N x M sized table. In the example below, we have a Loan and Borrower table, and the resulting Cartesian product. 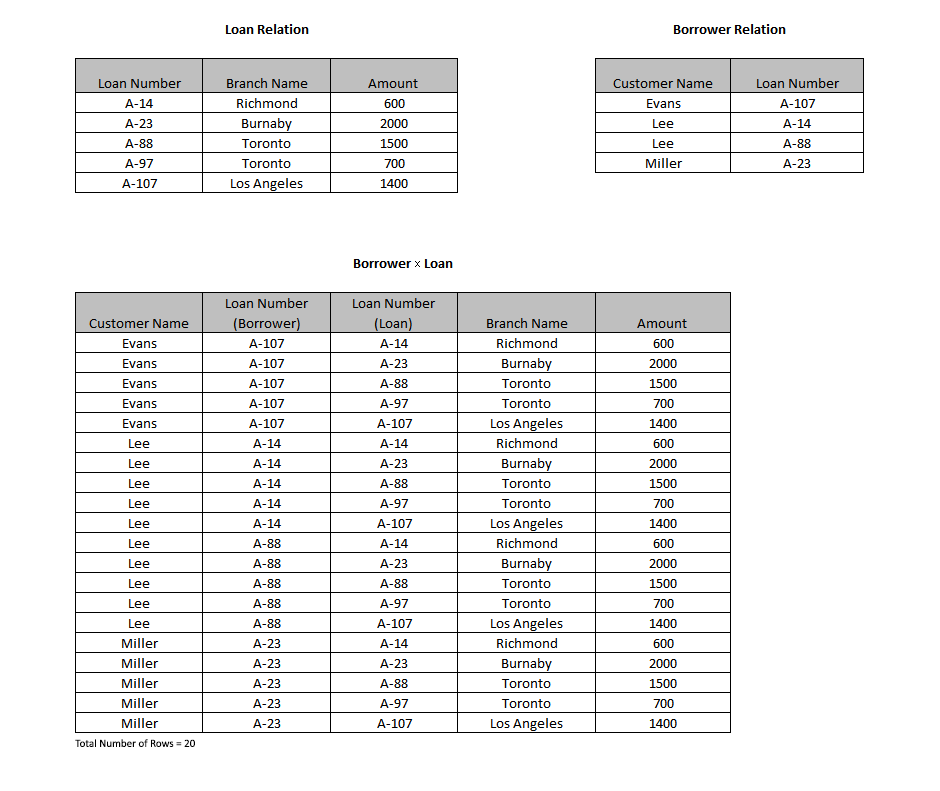 The reason why Web Intelligence does not allow us to put unmerged dimensions from both queries onto the same table is to prevent a Cartesian product. Luckily there are a couple tricks that we can use to allow us to insert unmerged dimensions from both queries without causing a Cartesian product.
Method 1: Detail object workaround (not recommended)
An attribute gives more descriptive data to their associated dimension (e.g. Customer dimension with a First Name attribute). Attributes are referred to as detail objects. There must be a one-to-one relationship between dimensions and details (e.g. each Customer dimension value can only be associated with one value in the First Name detail). Otherwise that detail will display a #MULTIVALUE error.
Step 1:
Create a detail variable in the report. Fill in the Name, select the Year dimension as the Associated Dimension, and then drag or type in the incompatible State object into the Formula box. Click the OK button. 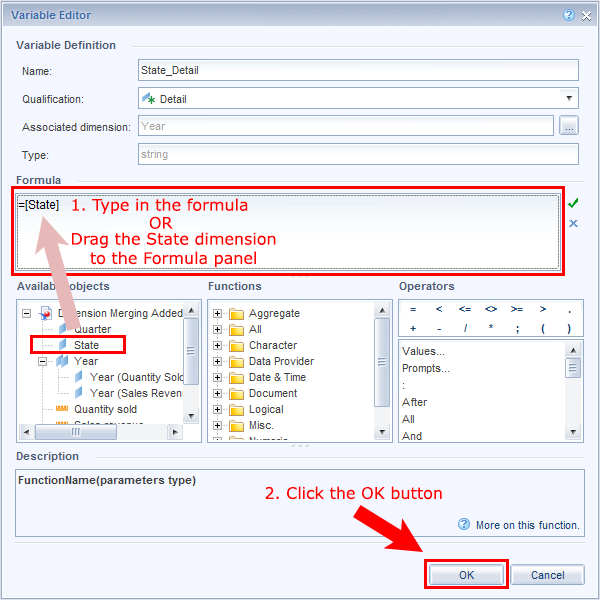
Step 2:
Now drag the State_Detail under the Variables folder to the table in the report containing the Year and Quarter dimensions. Note the #MULTIVALUE values in this column of the table. This is because Year and State do not have a one-to-one relationship but a one-to-many relationship. For reference, the State field is included separately in the middle table of the report to show the multiple state values to each year. 
Step 3:
To change the one-to-many relationship that the Year dimension and State detail currently have, we will need to edit the second query so that it results in every year having only one state. We are going to select the state of California in this example but any single state would be sufficient. Under the Query Filters panel, drag the State dimension and select it to be Equal To the state of California. Finally, click the Run Queries button. 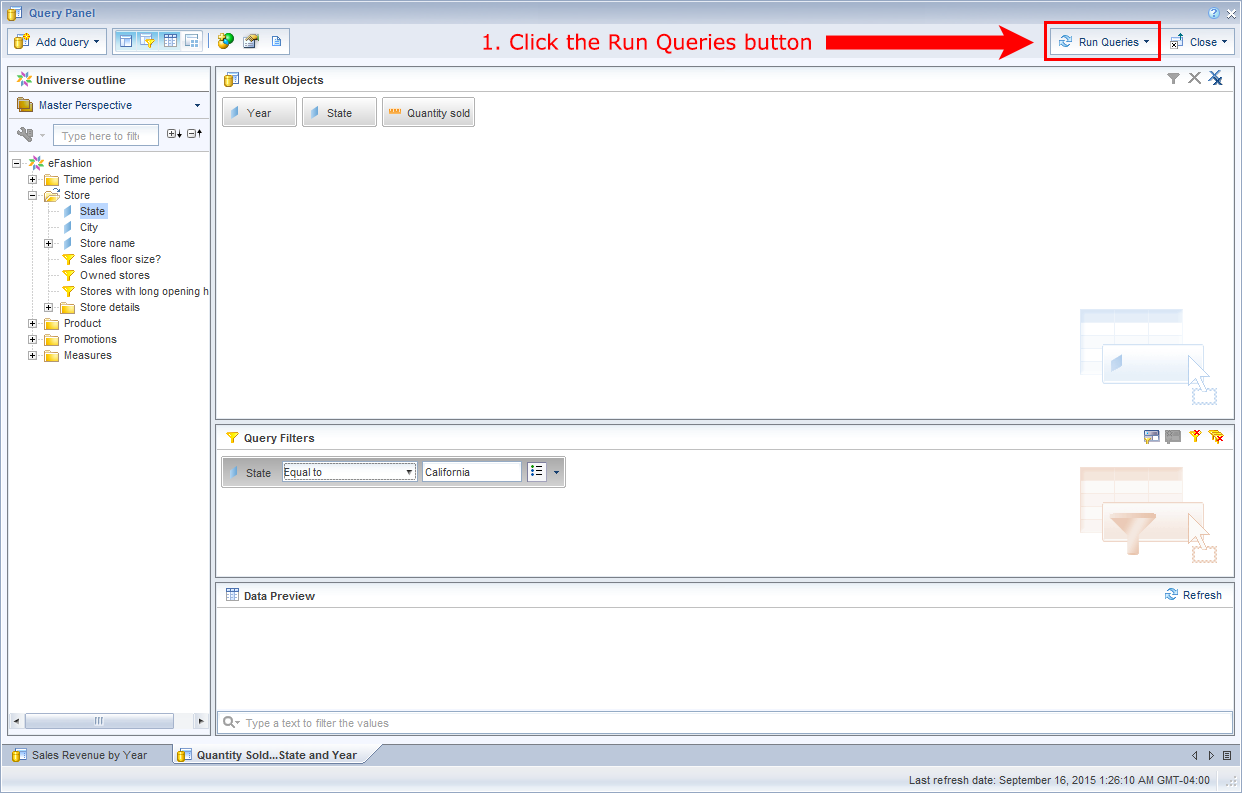
Step 4:
Drag the Sales Revenue and Quantity Sold measures into the combined table of the two queries to view their corresponding values for each combination of dimensions.  Notice that all the State_Detail values are now California and no longer the #MULTIVALUE error. This is because the parent dimension, Year, now has a one-to-one relationship with the child dimension State. Now there is no longer the possibility of a Cartesian product occurring.
Note that the detail method only works if there is a one to one relationship between the unmerged dimension and the merged parent dimension. In addition if there are more than 1 merged dimensions we cannot create a detail object on more than one parent dimension key.
Method 2: Max Function
In the second example, we will introduce another workaround using the max function. This function simply selects the maximum value from a given dimension and can be used when creating a new variable.
Step 1:
First let’s add the Month and Quarter dimension objects to Query 1 and only the Quarter dimension object to Query 2.
Make sure Year and Quarter are now merged. 
When building a table with unmerged dimensions, we are only allowed either the Month dimension from the first query or the State dimension from the second query. Let us add the State dimension first and then figure out how to add the unmerged Month dimension.
Step 2:
Create a detail object using the Month dimension to show how the previous will not work. Name the variable, select Detail as the Qualification, Associate it with the Year dimension and type or drag into the Formula text box the Month dimension. Click the OK button to finish creating the detail. 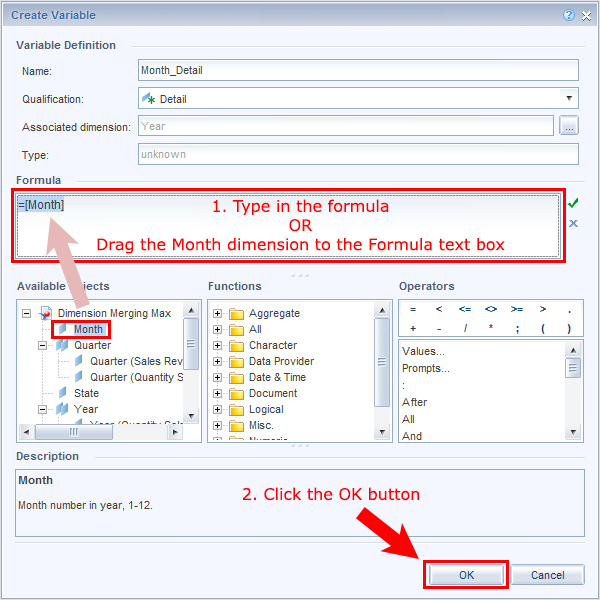
Step 3:
In the Available Objects panel, drag the Year and the newly created Month_Detail objects to the report. Place the two objects adjacent to each other to create a new table.  Note the #MULTIVALUE error. Once again, this is because the relationship between the Year dimension and the Month detail is not one-to-one. It is actually a one-to-many relationship since a year can have many months associated with it.
In addition, the 2 queries now share 2 keys (Year and Quarter). There is no way to set the detail object where both keys are the parent. Thus the Detail Object method will not work!
Step 4:
We will now proceed in implementing the max function for the month dimension.
We are going to create a new variable that uses the max function on the Month dimension. First, give the new variable a Name. Next, type into the Formula text box the following line of code =Max([Month]). Click the OK button once completed. 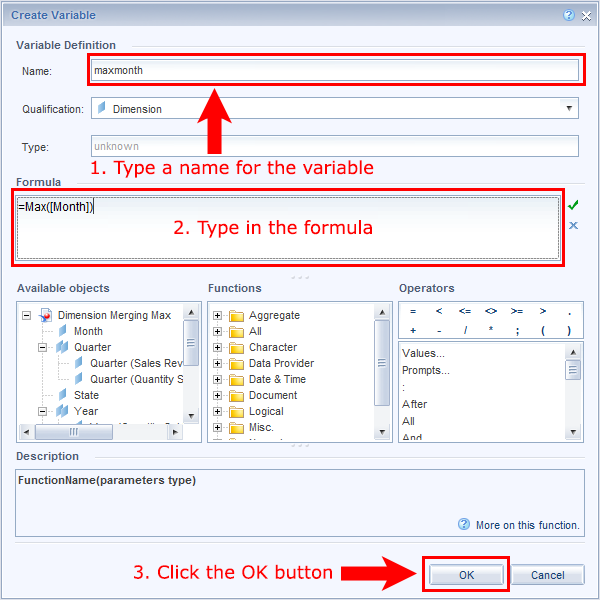
Step 5:
To preview the values of the maxmonth measure, first drag the Year and Quarter dimension to create a new table. Afterwards, drag the maxmonth measure to the table.  For each year and quarter combination, the maximum month is displayed for the maxmonth measure. For example, in the year 2004 and during the first quarter, Q1, Maxmonth will select 3.
Drag the State dimension object onto the same table and you will see that the State dimension shows up together with the maxmonth object without error. 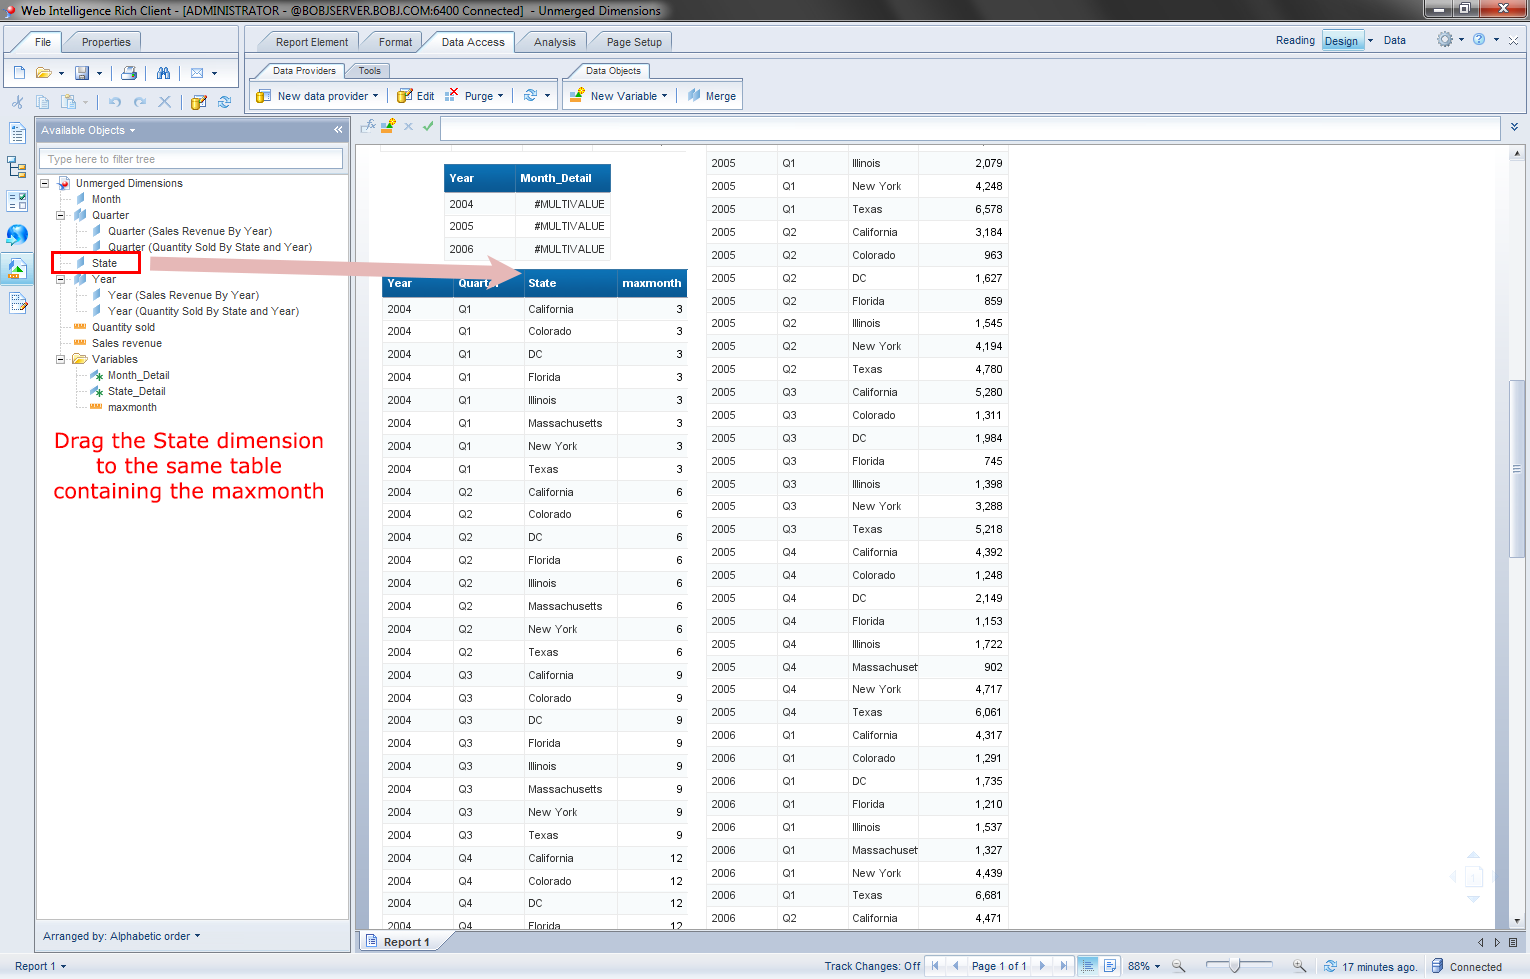
What we have learned:
We have learned that using the max or min function on an unmerged dimension will accomplish the following.
1. Handle multiple keys (In our case Year and Quarter)
2. With the unmerged dimensions Month and State, it is impossible to figure out which month (1,2,3) that the state “California” links to. Or what state the month 1 should link to. The real product would be a Cartesian product where the # of rows in the table = # of months * # states (multiplied by the year and quarter combo). This is not allowed by Web Intelligence, so max(month) will associate month 3 with state California.
At the end of the day, we cannot show the true Cartesian product table, however we can come up with something close.


Hi David
there is no way that the table will show following?
year quarter month state ……
2014 Q1 1 California …….
2014 Q1 1 Colorado …….
.
,
,
,
thanks
Hi Patrik,
Sure you can. On the revenue query add the month object in there.
Hope that helps