
Cascading Prompts in BOBJ Dashboards and WEBI
March 12, 2015 by: David LaiA cascading prompt, helps the user focus on values they want to include in the prompt without the need to go through every possible value. A great example comes from a list of cities around the world. Imagine if we had to go through a huge dropdown list every time in order to find our desired city. It would be much easier if we can first select a country, then province/state and then the city.
This article will go through step by step on creating a cascading prompt using the Adventure Works Data Warehouse 2012 provided for free from Microsoft. We will also be focusing solely on the DimGeography table creating a hierarchy using the dimensions English Country Region Name to State Province Name to City in order to create our cascading prompt.

Universe
Step 1:
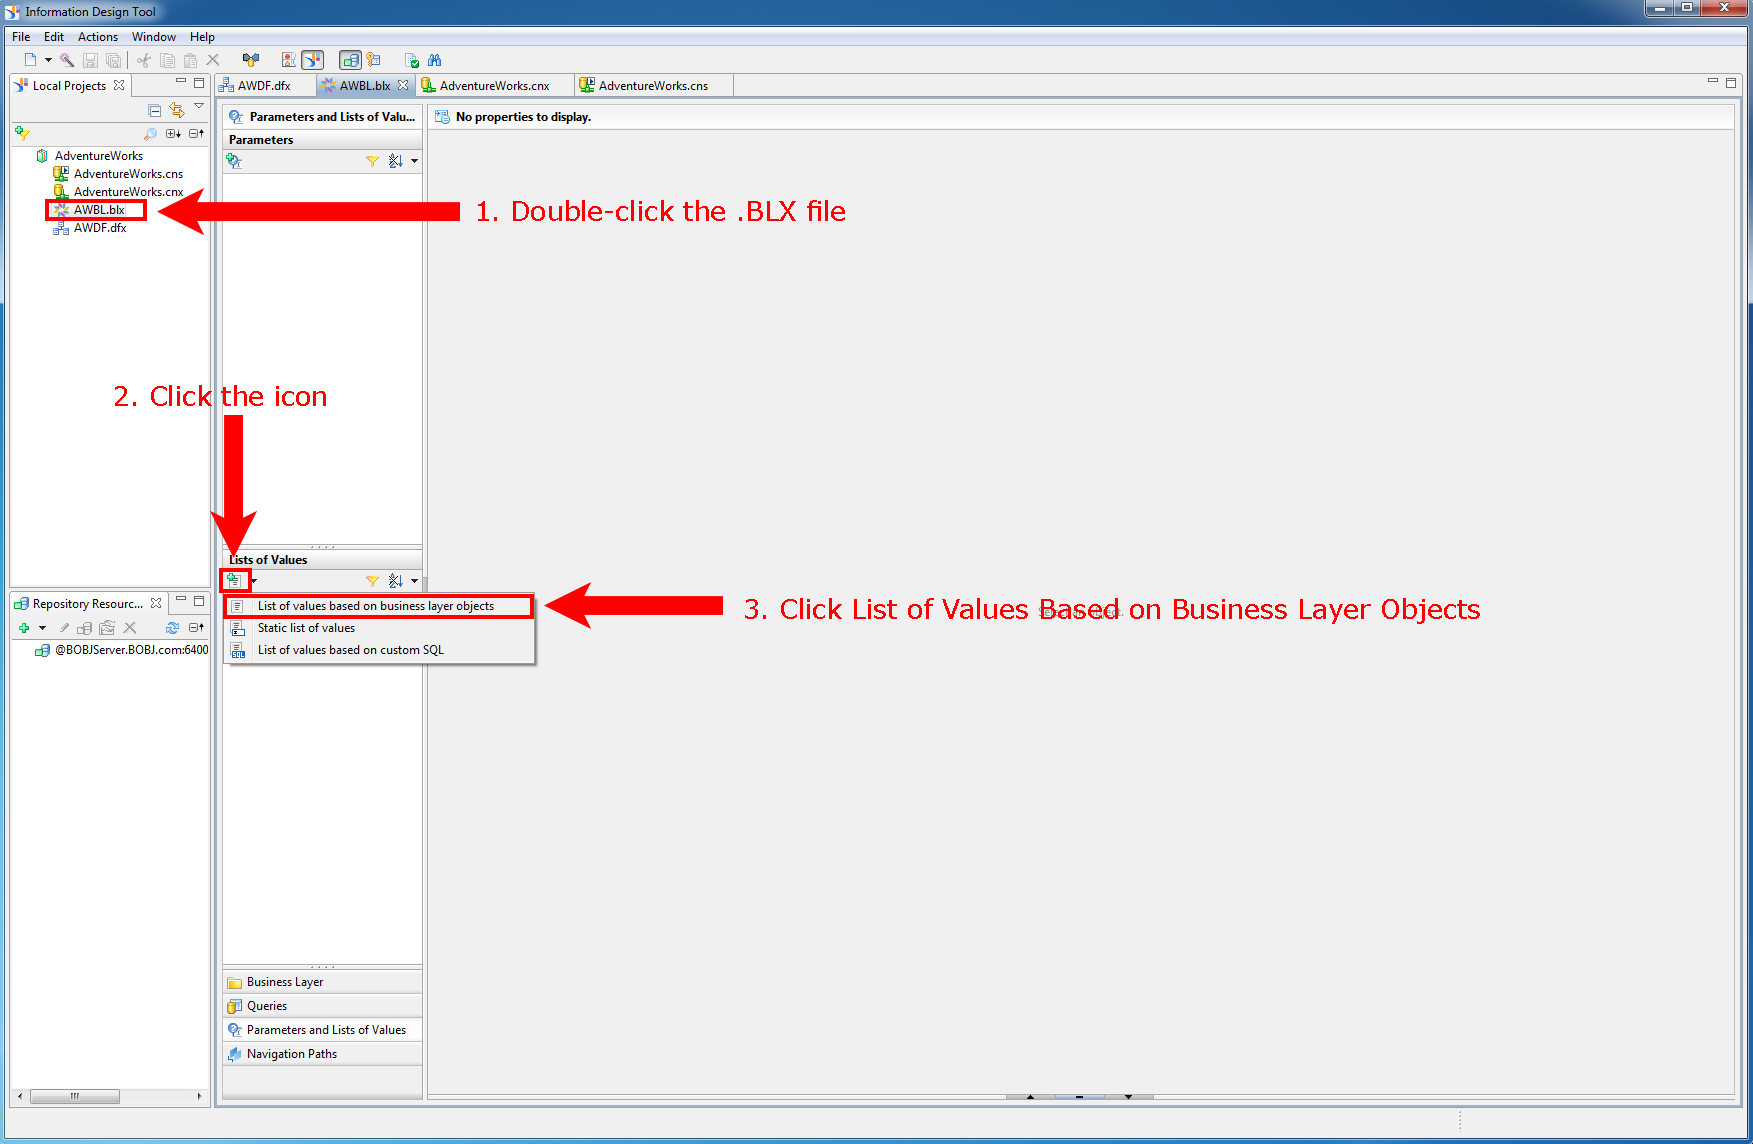
First, we need to be in the business layer. Double-click on the file with the .BLX extension. In the Parameters and Lists of Values pane, click the icon to open a menu to create a new list of values. Click the first option which is List of Values Based on Business Layer Objects.
Step 2:
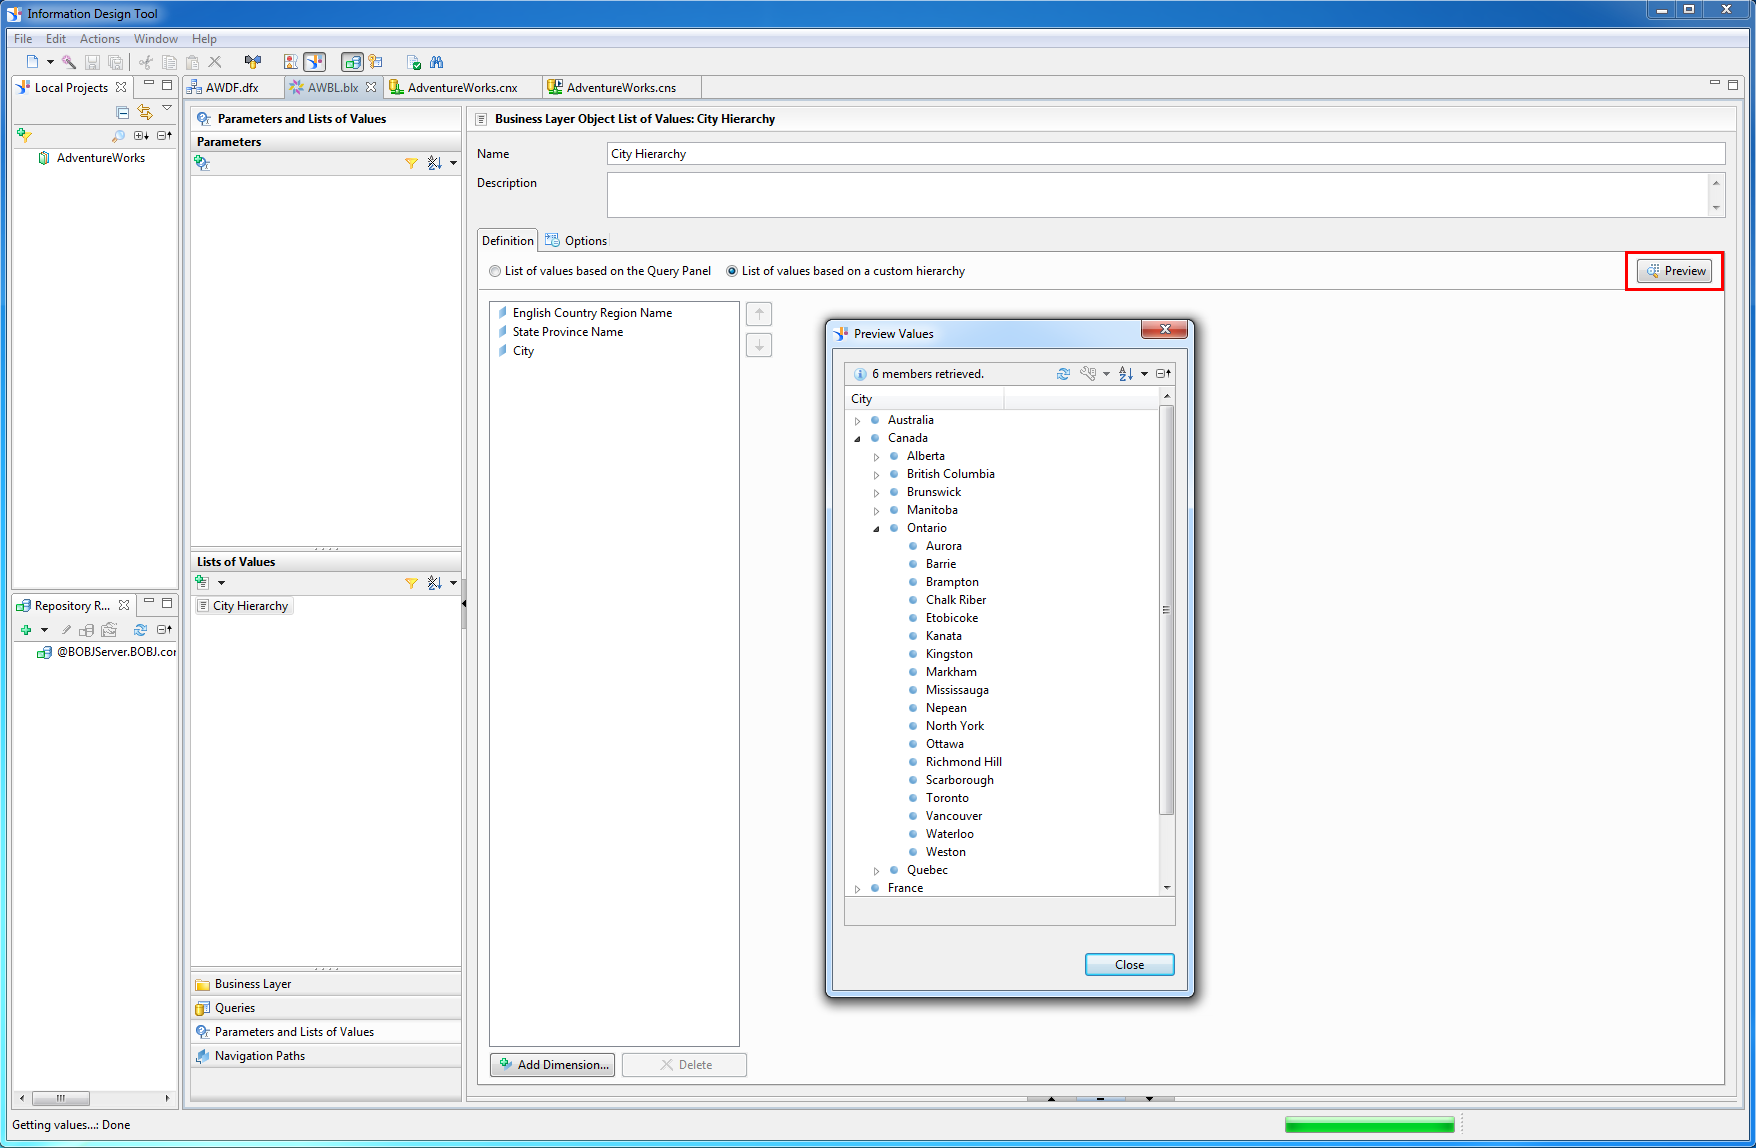
Under the definition tab, make sure the radio button beside List of Values Based on Custom Hierarchy is selected. Type a name for this list of values. In this example, we are going to name this list of values City Hierarchy. Click the Add Dimension… button to begin adding the three dimensions to the list of values.
Step 3:
Click the arrow beside the Dimensions folder to expand the available list of dimensions in the universe. Also click the Geography folder to expand the three dimensions that we want to include in the list of values. Click the City dimension while holding the Shift key and click the English Country Region Name to select all three dimensions. Click the Ok button.

Step 4:
Now we have to rearrange the dimensions to reflect the ordering of the hierarchy that we want, which is Country to Province to City. This means that a user will have to select the country first, then the province and finally the city. Rearrange the dimensions in this order from top to bottom using the Up and Down arrow keys: English Country Region Name, State Province Name, City.

Step 5:
Click the Preview button to view if the hierarchy has been properly configured, so that it is nicely displayed as a tree structure, instead of having to go through the entire list of cities across the world.
Step 6:
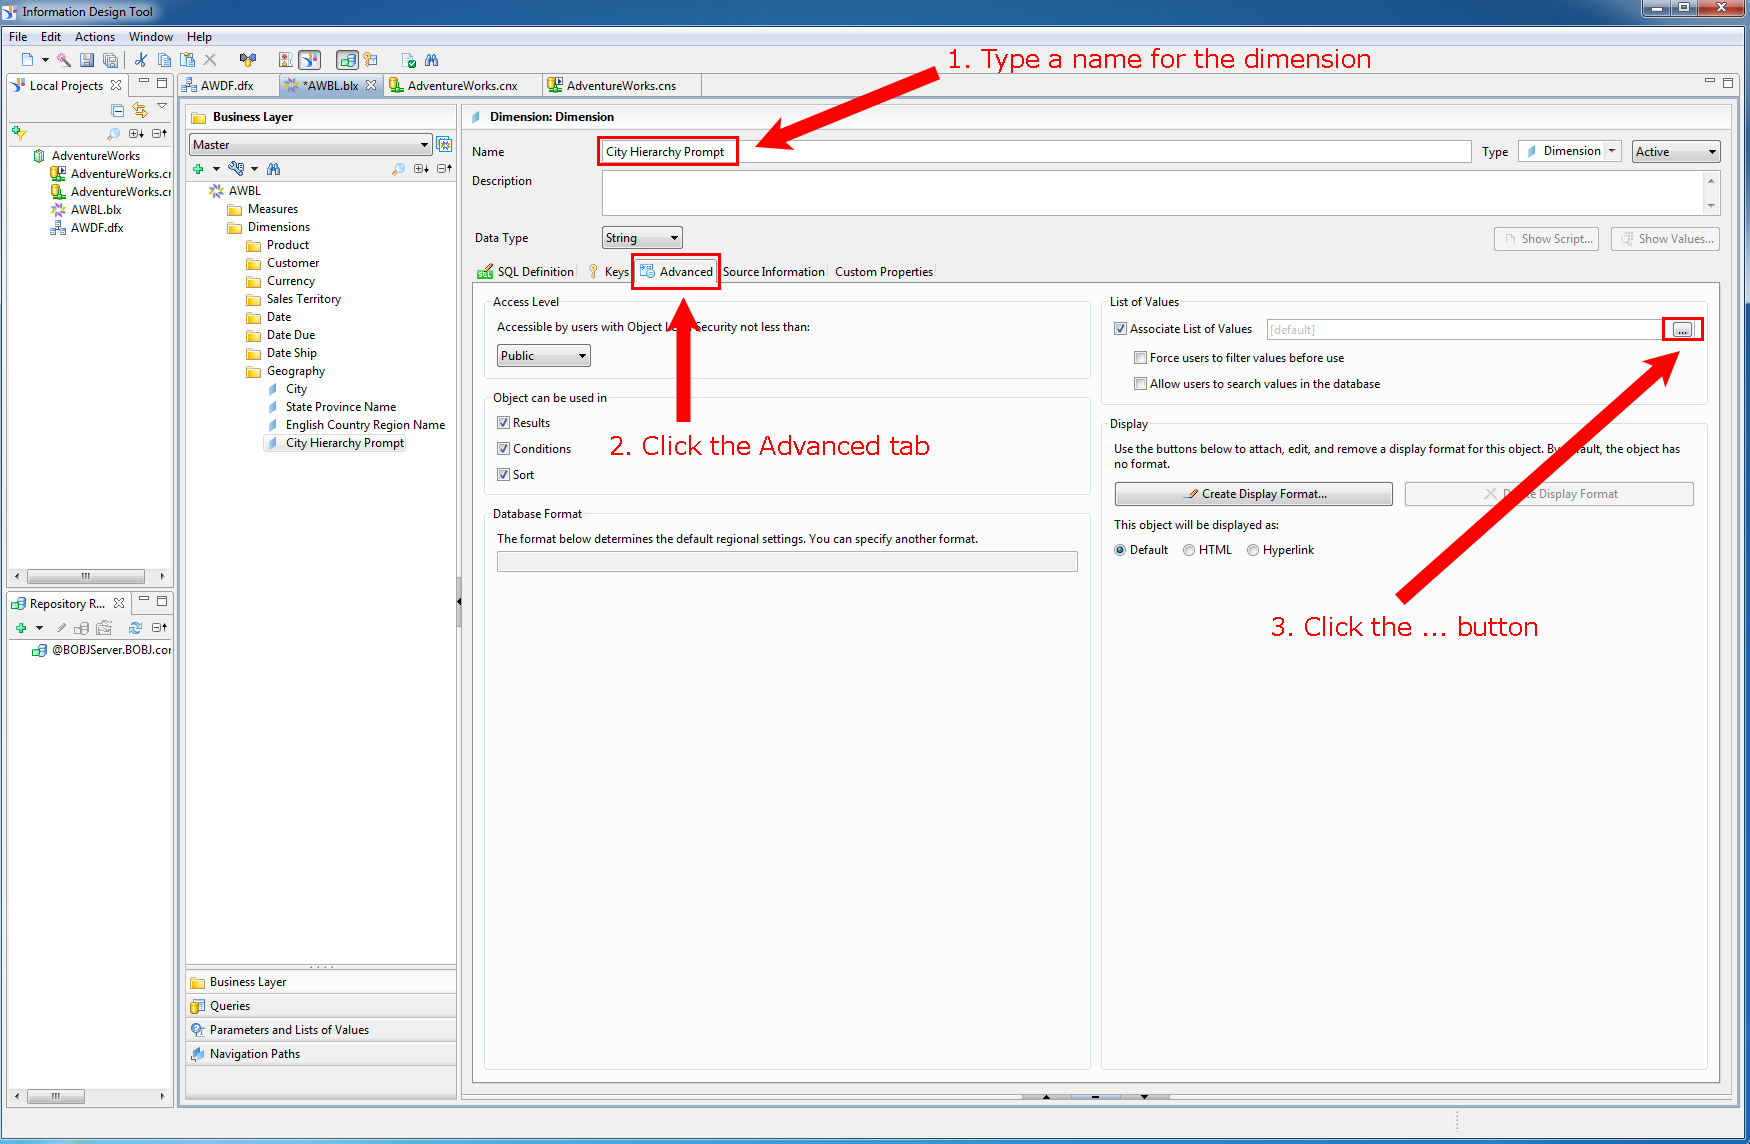
On the Business Layer pane, we are going to create a new dimension to hold our Lists of Values (LOV). In this example, we are going to create a new dimension in the Geography folder called City Hierarchy Prompt. Link the dimension to the City column of the geography table. Then click the Advanced tab and the … button to associate the List of Values (LOV) to this dimension.
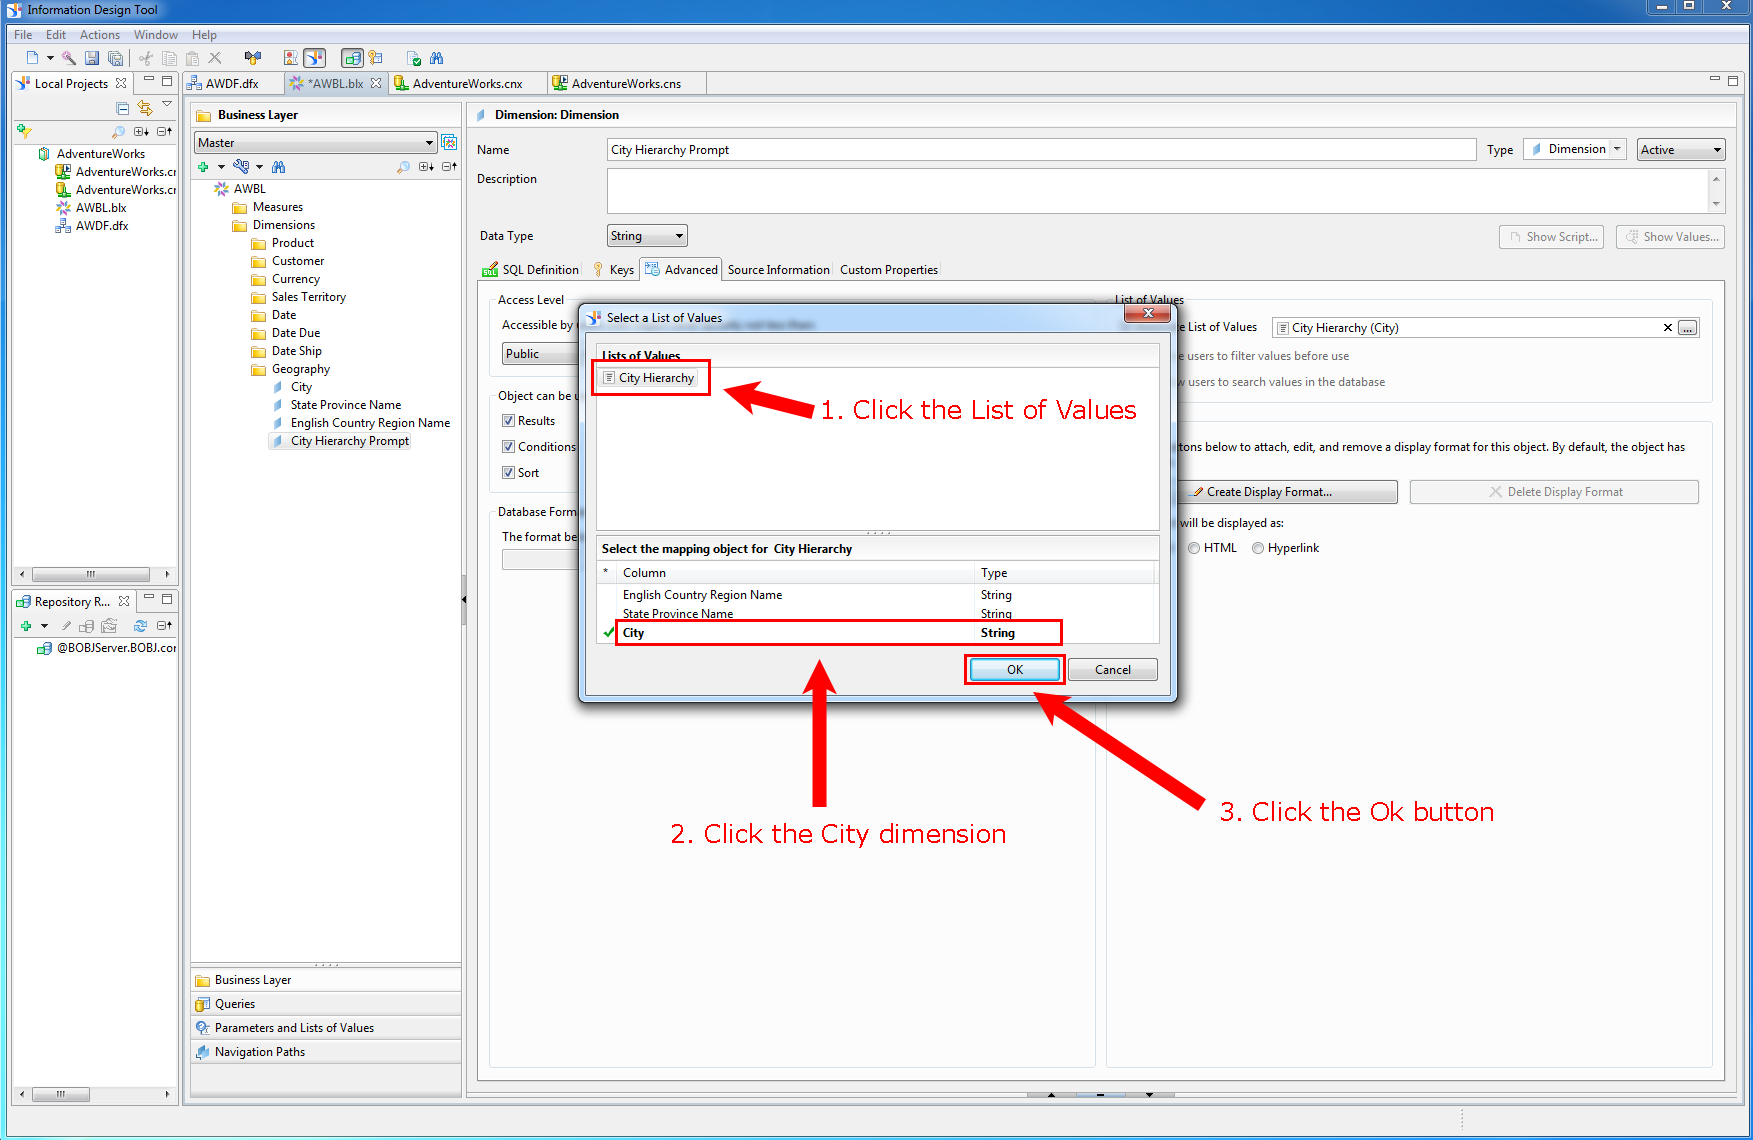
Step 7:
In the Select a List of Values window, click the City Hierarchy List of Vales (LOV) that we created in Step 2. Make sure to select City as the mapping object otherwise it will not display the hierarchy correctly as only countries or provinces would be shown. Click the Ok button.
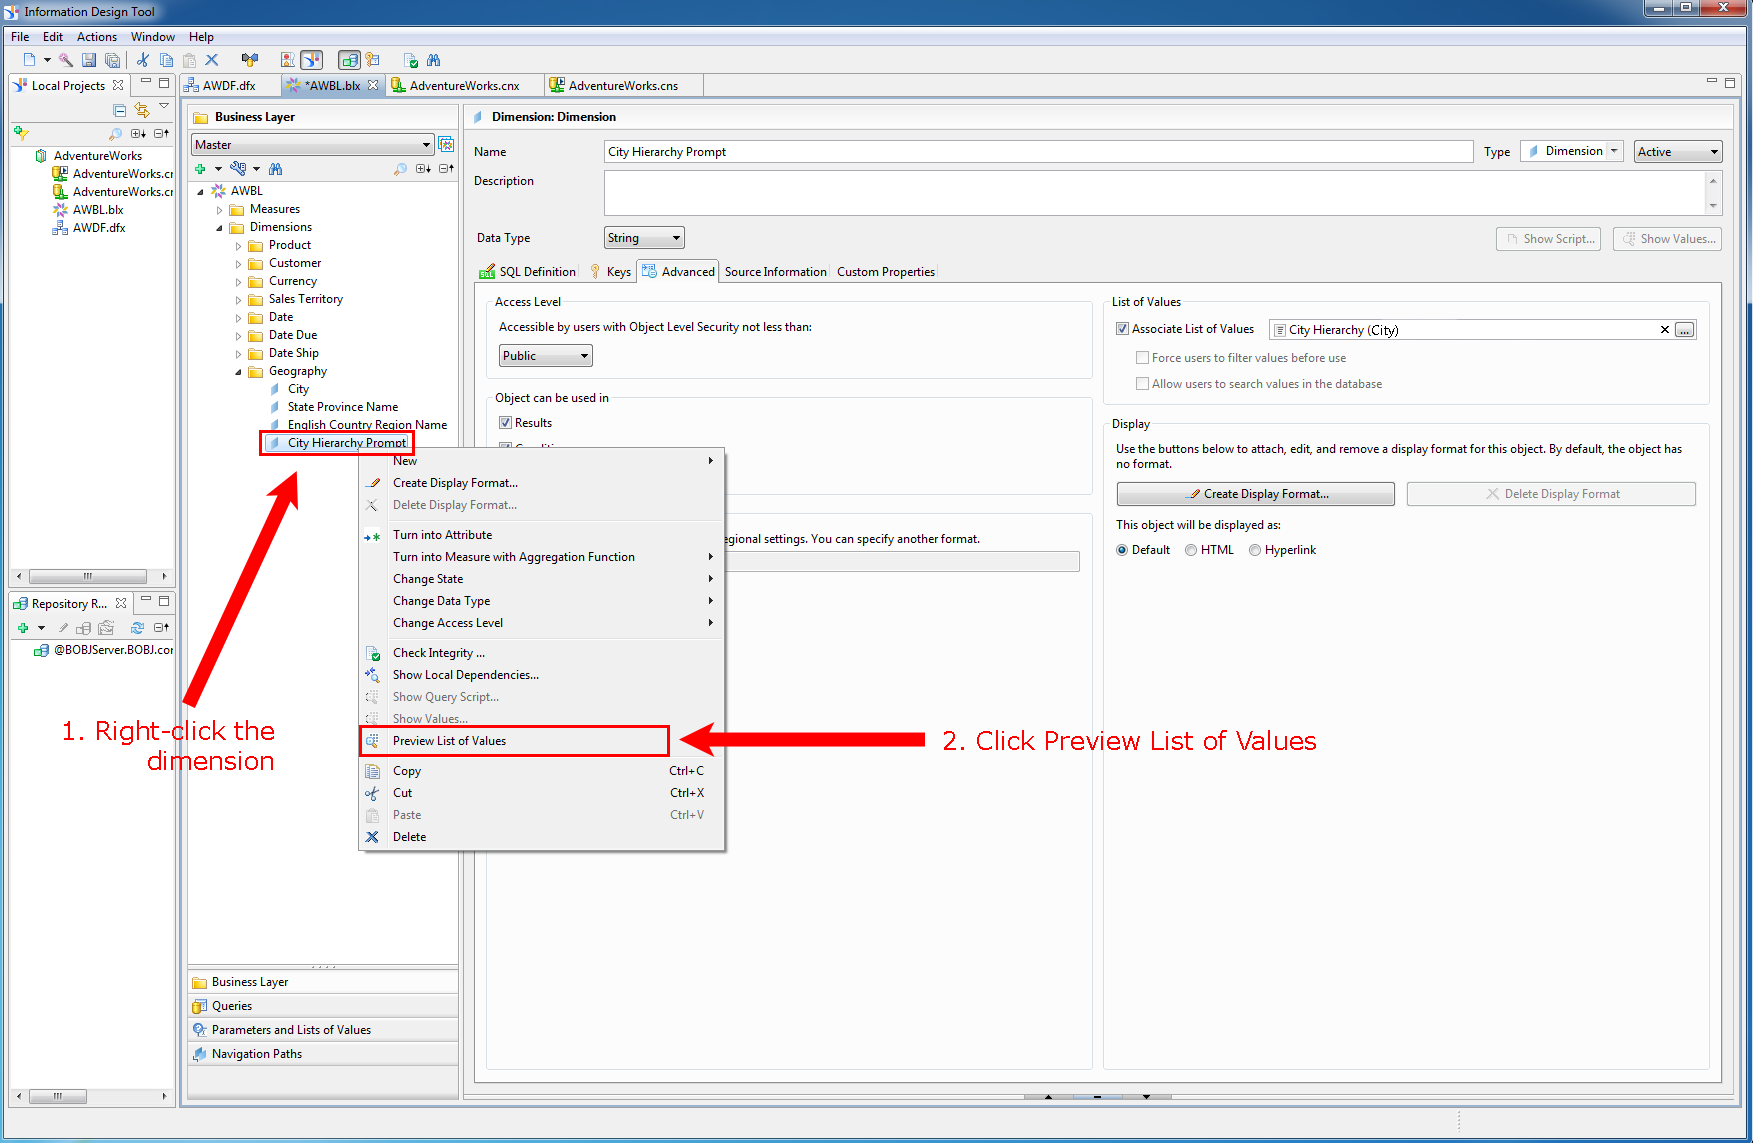
Step 8:
Preview the City Hierarchy Prompt dimension that we just created to see if it displays the hierarchy correctly. Right-click the dimension. Click the Preview List of Values option. Then publish the universe to the repository.
Web Intelligence
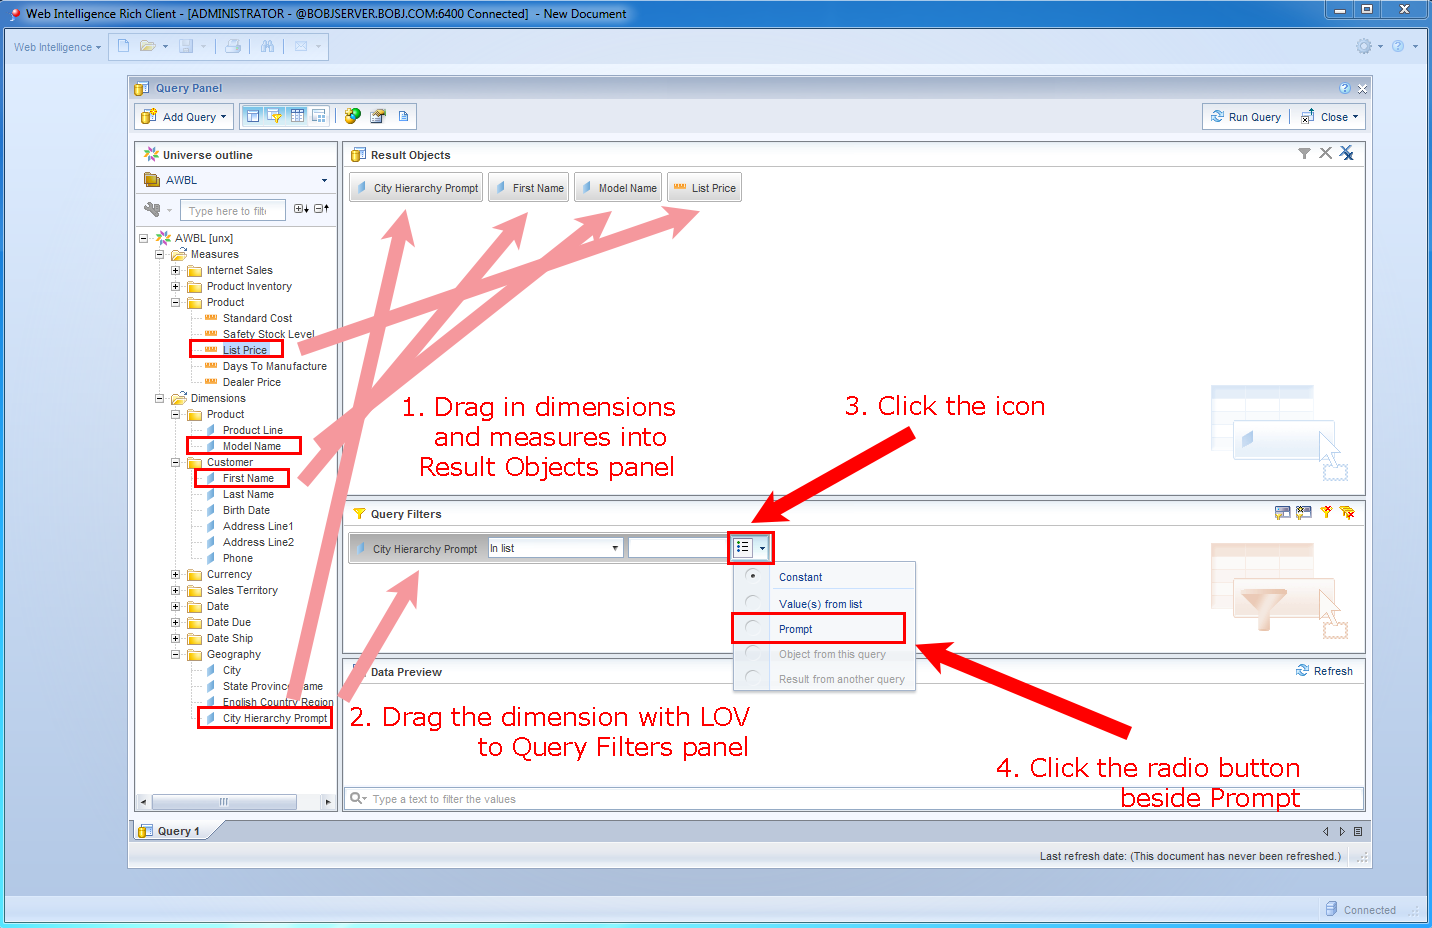
Step 1:
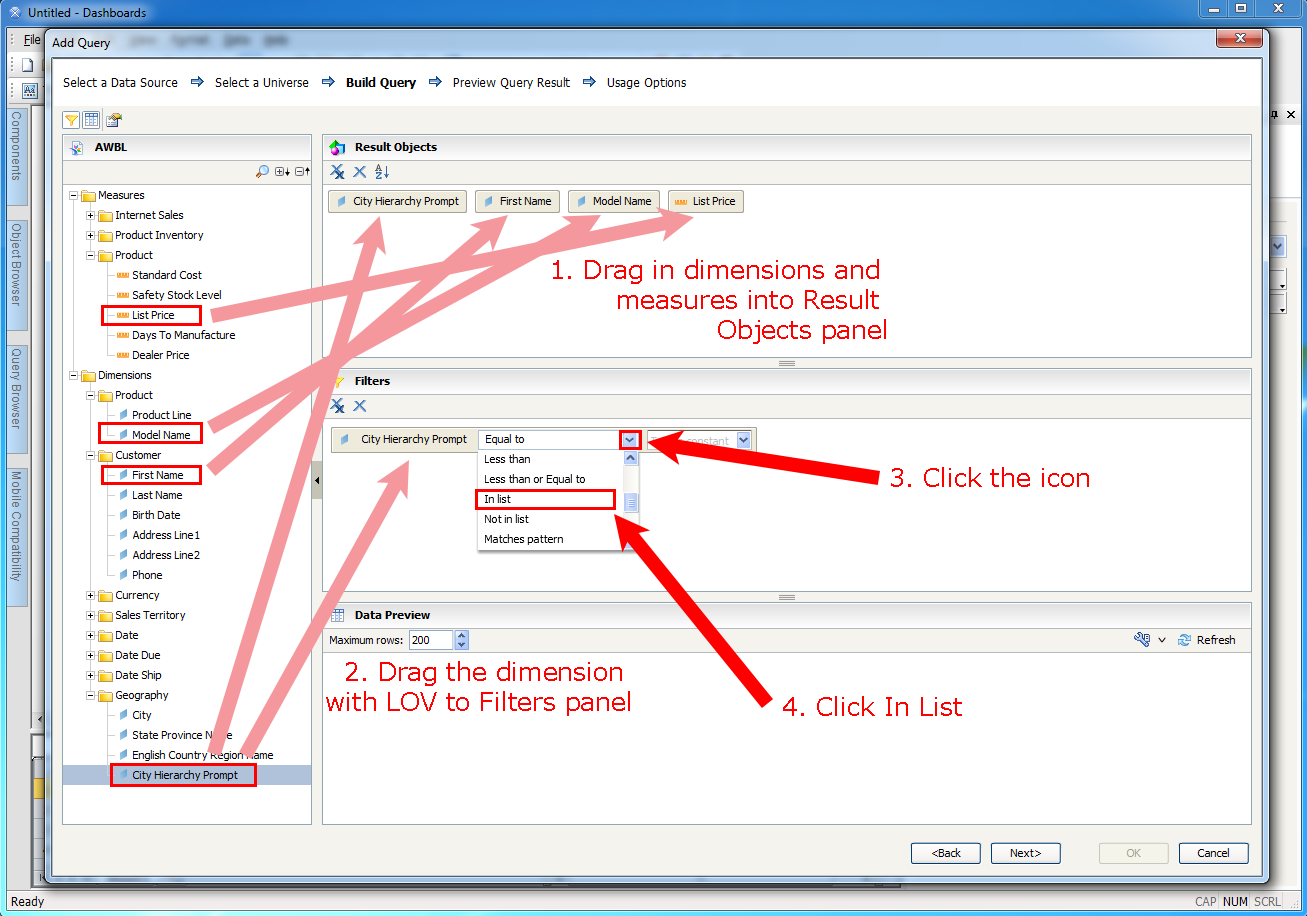
We are now going to implement the cascading prompt in Web Intelligence (WEBI). Open Web Intelligence Rich Client and create a new WEBI report. Drag the City or City Hierarchy Prompt dimension object into the Result Objects panel. Select a couple other dimensions and measures just for fun.
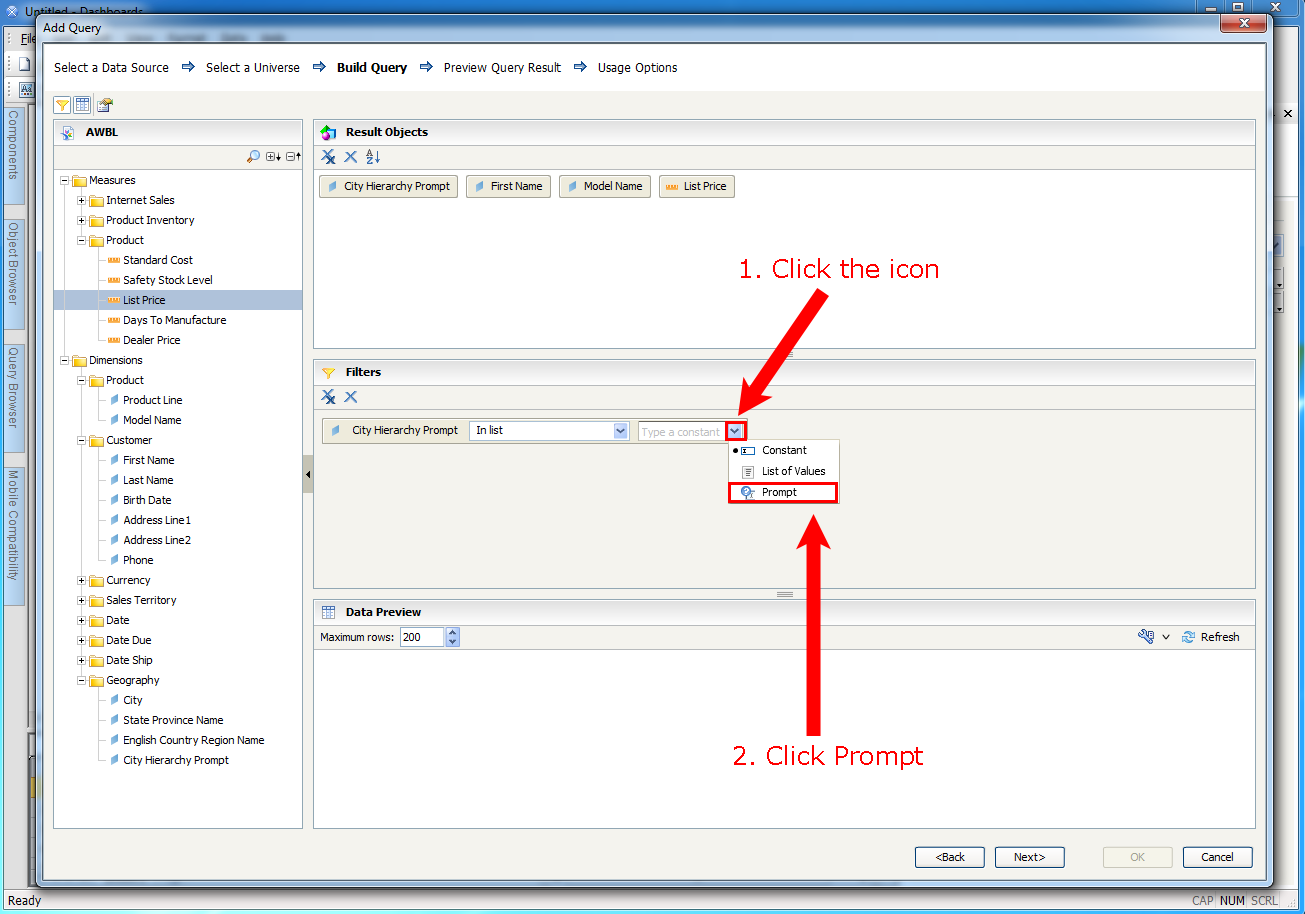
In the Query Filter panel and drag the City Hierarchy Prompt into it. Click the icon and choose Prompt as the operand type.
Step 2:
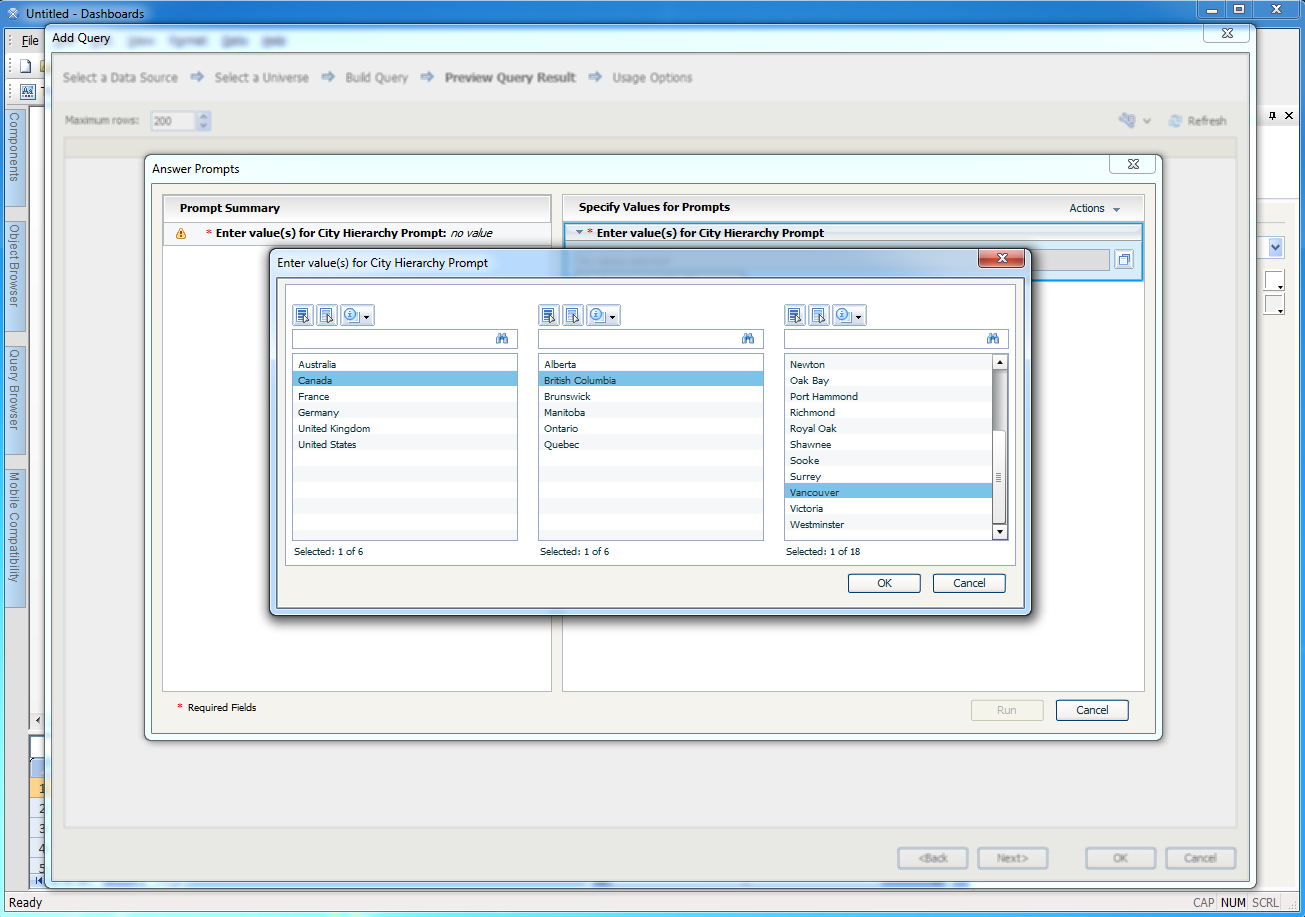
Click the Run Query button to execute the query. A prompt will appear asking you to select the country, province and/or city that you want in the WEBI report. If you want to drilldown to a province or city, you will need to expand the appropriate country or province by clicking the plus icon to the left to reveal more province and/or city options. Click the > button to confirm your selection. In this example, we are going to use the city Vancouver by selecting Canada and then British Columbia before selecting Vancouver.

Step 3:
Verify that the report displays the correct dimensions and measures.

We have successfully implemented a cascading prompt in Web Intelligence (WEBI) using List of Values Based on Custom Hierarchy!
SAP BusinessObjects Dashboards
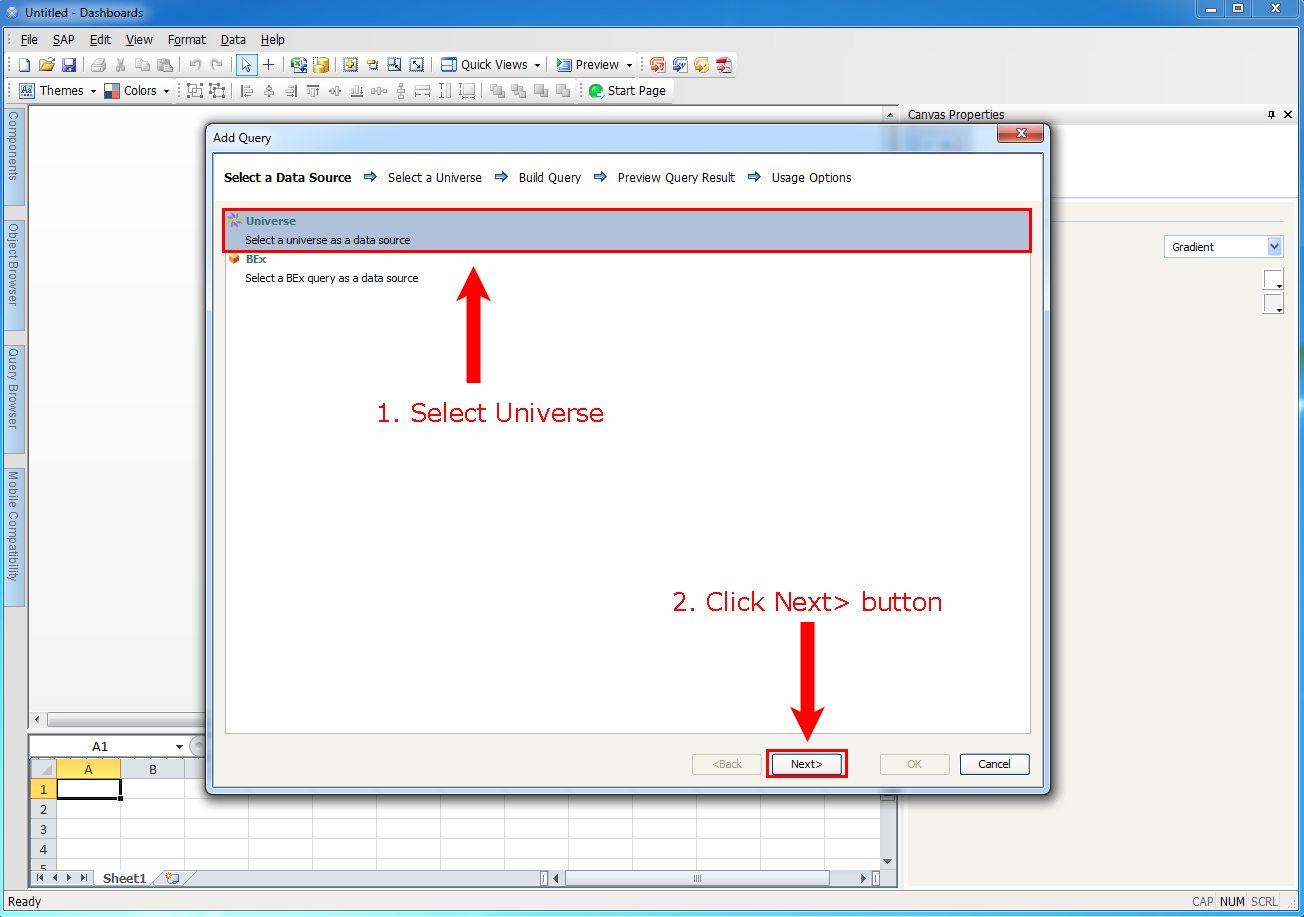
Step 1:
Similarly, now we are going to show that the same cascading prompt, using List of Values Based on Custom Hierarchy designed in the Information Design Tools, works in BOBJ Dashboards as well. Open BOBJ Dashboards and create a new blank model. Click on the Query Browser tab. Click the Add Query button.

Step 2:
Select the Universe option as a data source. Click the Next> button.
Step 3:
Select the .UNX file that we published to the repository back in Step 8, expanding folders if necessary to find the file. Click the Next> button once you have selected the .UNX file.

Step 4:
We are going to select the same dimensions, measures and filters used in the Web Intelligence (WEBI) report.
Step 5:
In the Edit Prompt window, leave everything as the default values. Click the Ok button.

Step 6:
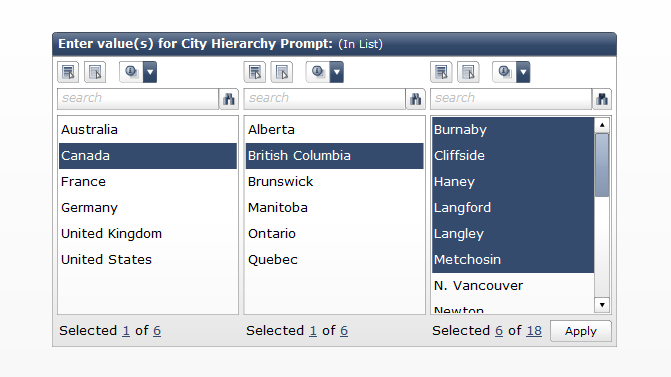
Click Next> to preview the results. A prompt will popup. You will first need to select the country(s) in the first column of values to the left, then the province(s) and finally the city(s) in the last column of values.
We have successfully implemented a cascading prompt in BOBJ Dashboards using List of Values Based on Custom Hierarchy.
Notice that in the Web Intelligence (WEBI) implementation of the cascading prompt a tree structure is shown rather than 3 list selectors. In my opinion it is more user friendly to traverse through a tree hierarchy rather than through multiple lists


Hi David,
Thanks for sharing this..
Its great pleasure to go through this post..
It help me lot!!
Warm Regards
Soumya Ranjan
Hi David,
It’s very useful. Can we setup cascading filters in WebI report inplace of cascading promts? Please advice.
Thanks, Anurag
Hi Anurag,
Unfortunately cascading filters will only work if you are building a query off a BICS connection.
If you are building it off a datawarehouse universe then it will not work.
Hi David,
can we using cascading LOV’s as Input control and achieve the hierarchical effect in BO 4.2?
Not yet.
But in BI 4.2 SP4 I think cascading LOV as input controls will be available.