
Importance of Web Intelligence Contexts
October 16, 2008 by: David LaiWith calculation contexts in web intelligence we are able to generate powerful reports quick and easily.
Let’s take an example where we have the following dimensions (year, quarter, product) and measure (revenue).

We can easily build a table to represent the sales revenue for each product in that quarter and year.
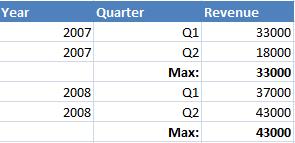
Now what if we wanted to display the sales revenue in a different context. For example we might want to display the highest quarter’s revenue each year.
You can add an aggregate row that happens after each year and retreive the highest quarter’s revenue from there.
But what if we want our values combined with the first table? This is where context calculation is important.
To accomplish this we need to take into account 3 points
calculation – maximum revenue
input context – year, quarter
output context – year
The combination of input and output contexts tells web intelligence to sum the revenue for each year/quarter and then output the maximum value for each year.
The formula to accomplish this is as follows “calculation(input context) output context” => Max([Revenue] In ([Year];[Quarter])) In ([Year])
The result will come out as the following

Finally we can insert the formula into the last column of the first table and instead of having 2 tables we can have everything on 1 table.


very easy to understand. i have implemented to read kind kind of compexity in my dashboard
there is a required very much technical espertise to develop any complex report.
Or practice can become a develop complex report??
Pls suggest